Projects
Campus Residence Site Design (AutoCAD Civil 3D)
November - December 2025
A conceptual campus residence site plan developed from field survey data collected using an auto level and total station. Completed collaboratively as part of a team, the project involved integrating surveyed point elevations into AutoCAD Civil 3D to produce grading and elevation models, building footprint layouts, parking configurations, and site infill plans. The design was developed in accordance with City of Waterloo zoning by-laws and accessibility and drainage requirements, while also incorporating sustainable stormwater management considerations through the sizing and placement of bioretention features.
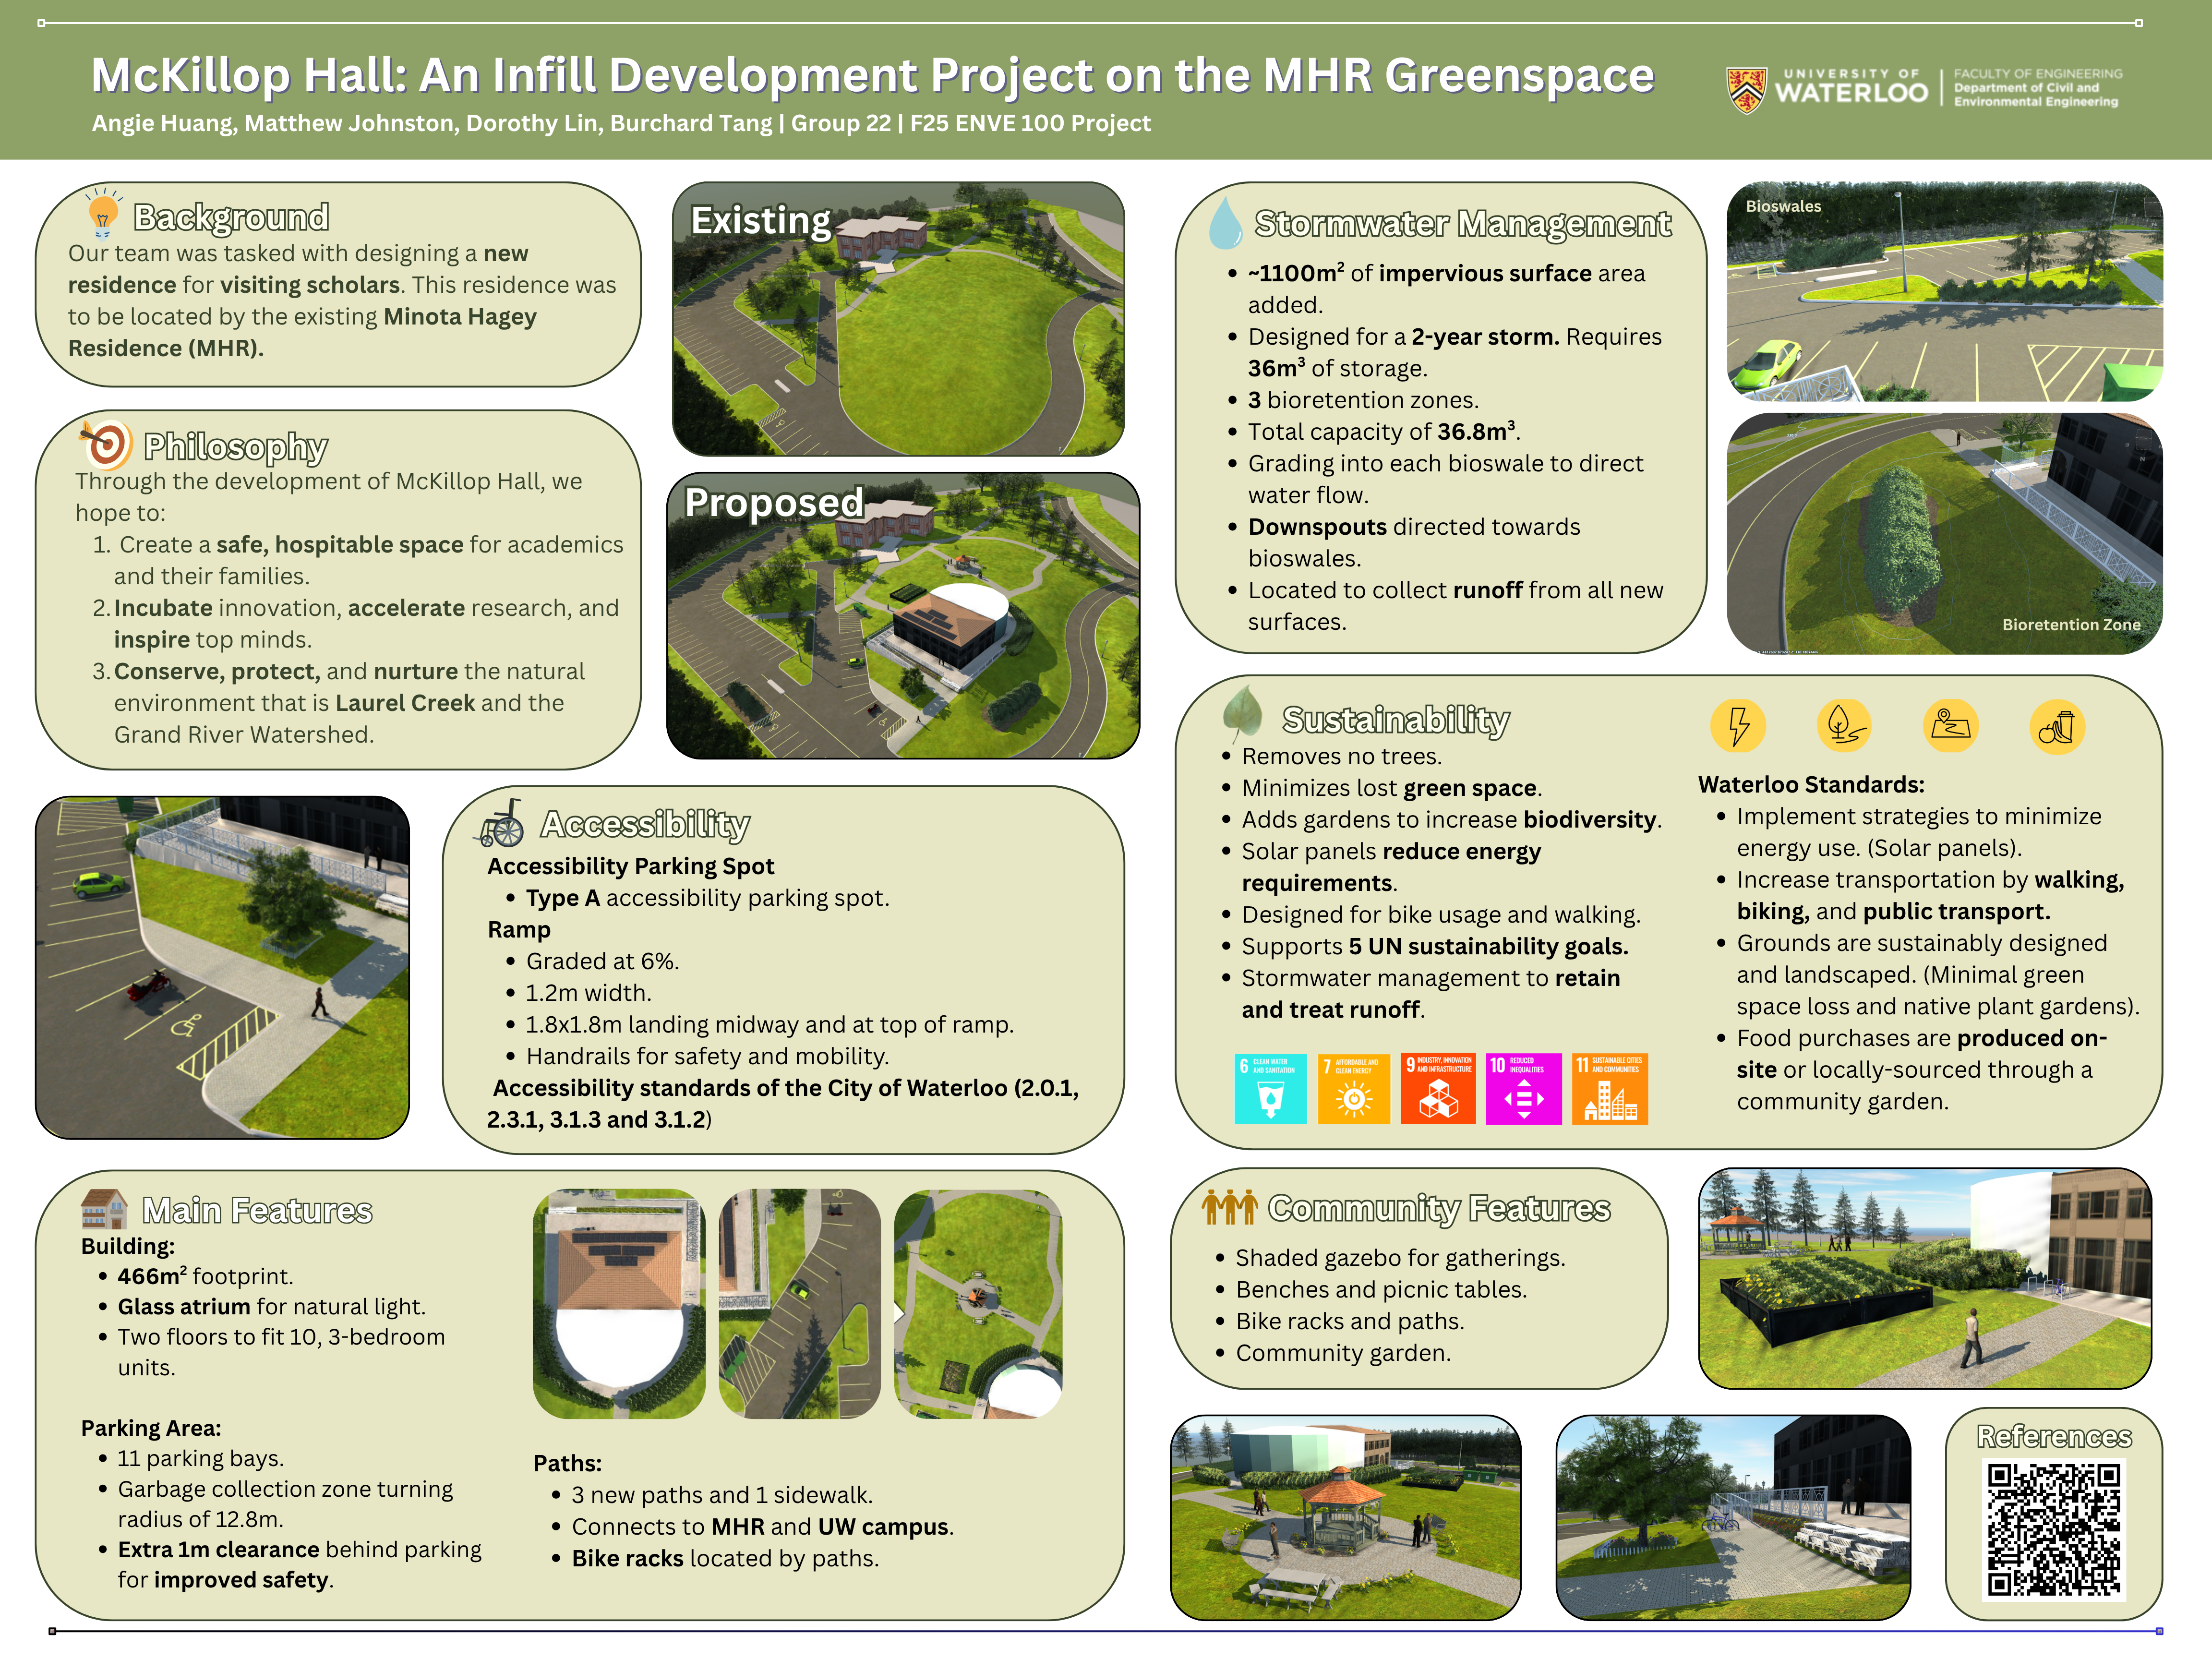
Poster displaying the proposed residence's features.
Modelling CANDU Reactor Parts (SolidWorks)
October 2025
Models of components based on CANDU-6 reactors to eventually form a full assembly of the calandria, fuel tubes passing through it, and end fittings of the fuel tubes. Driven by a curiosity about nuclear reactors, by modelling one, I hope to better appreciate all the engineering that contributes to making them function, function efficiently, and function safely.
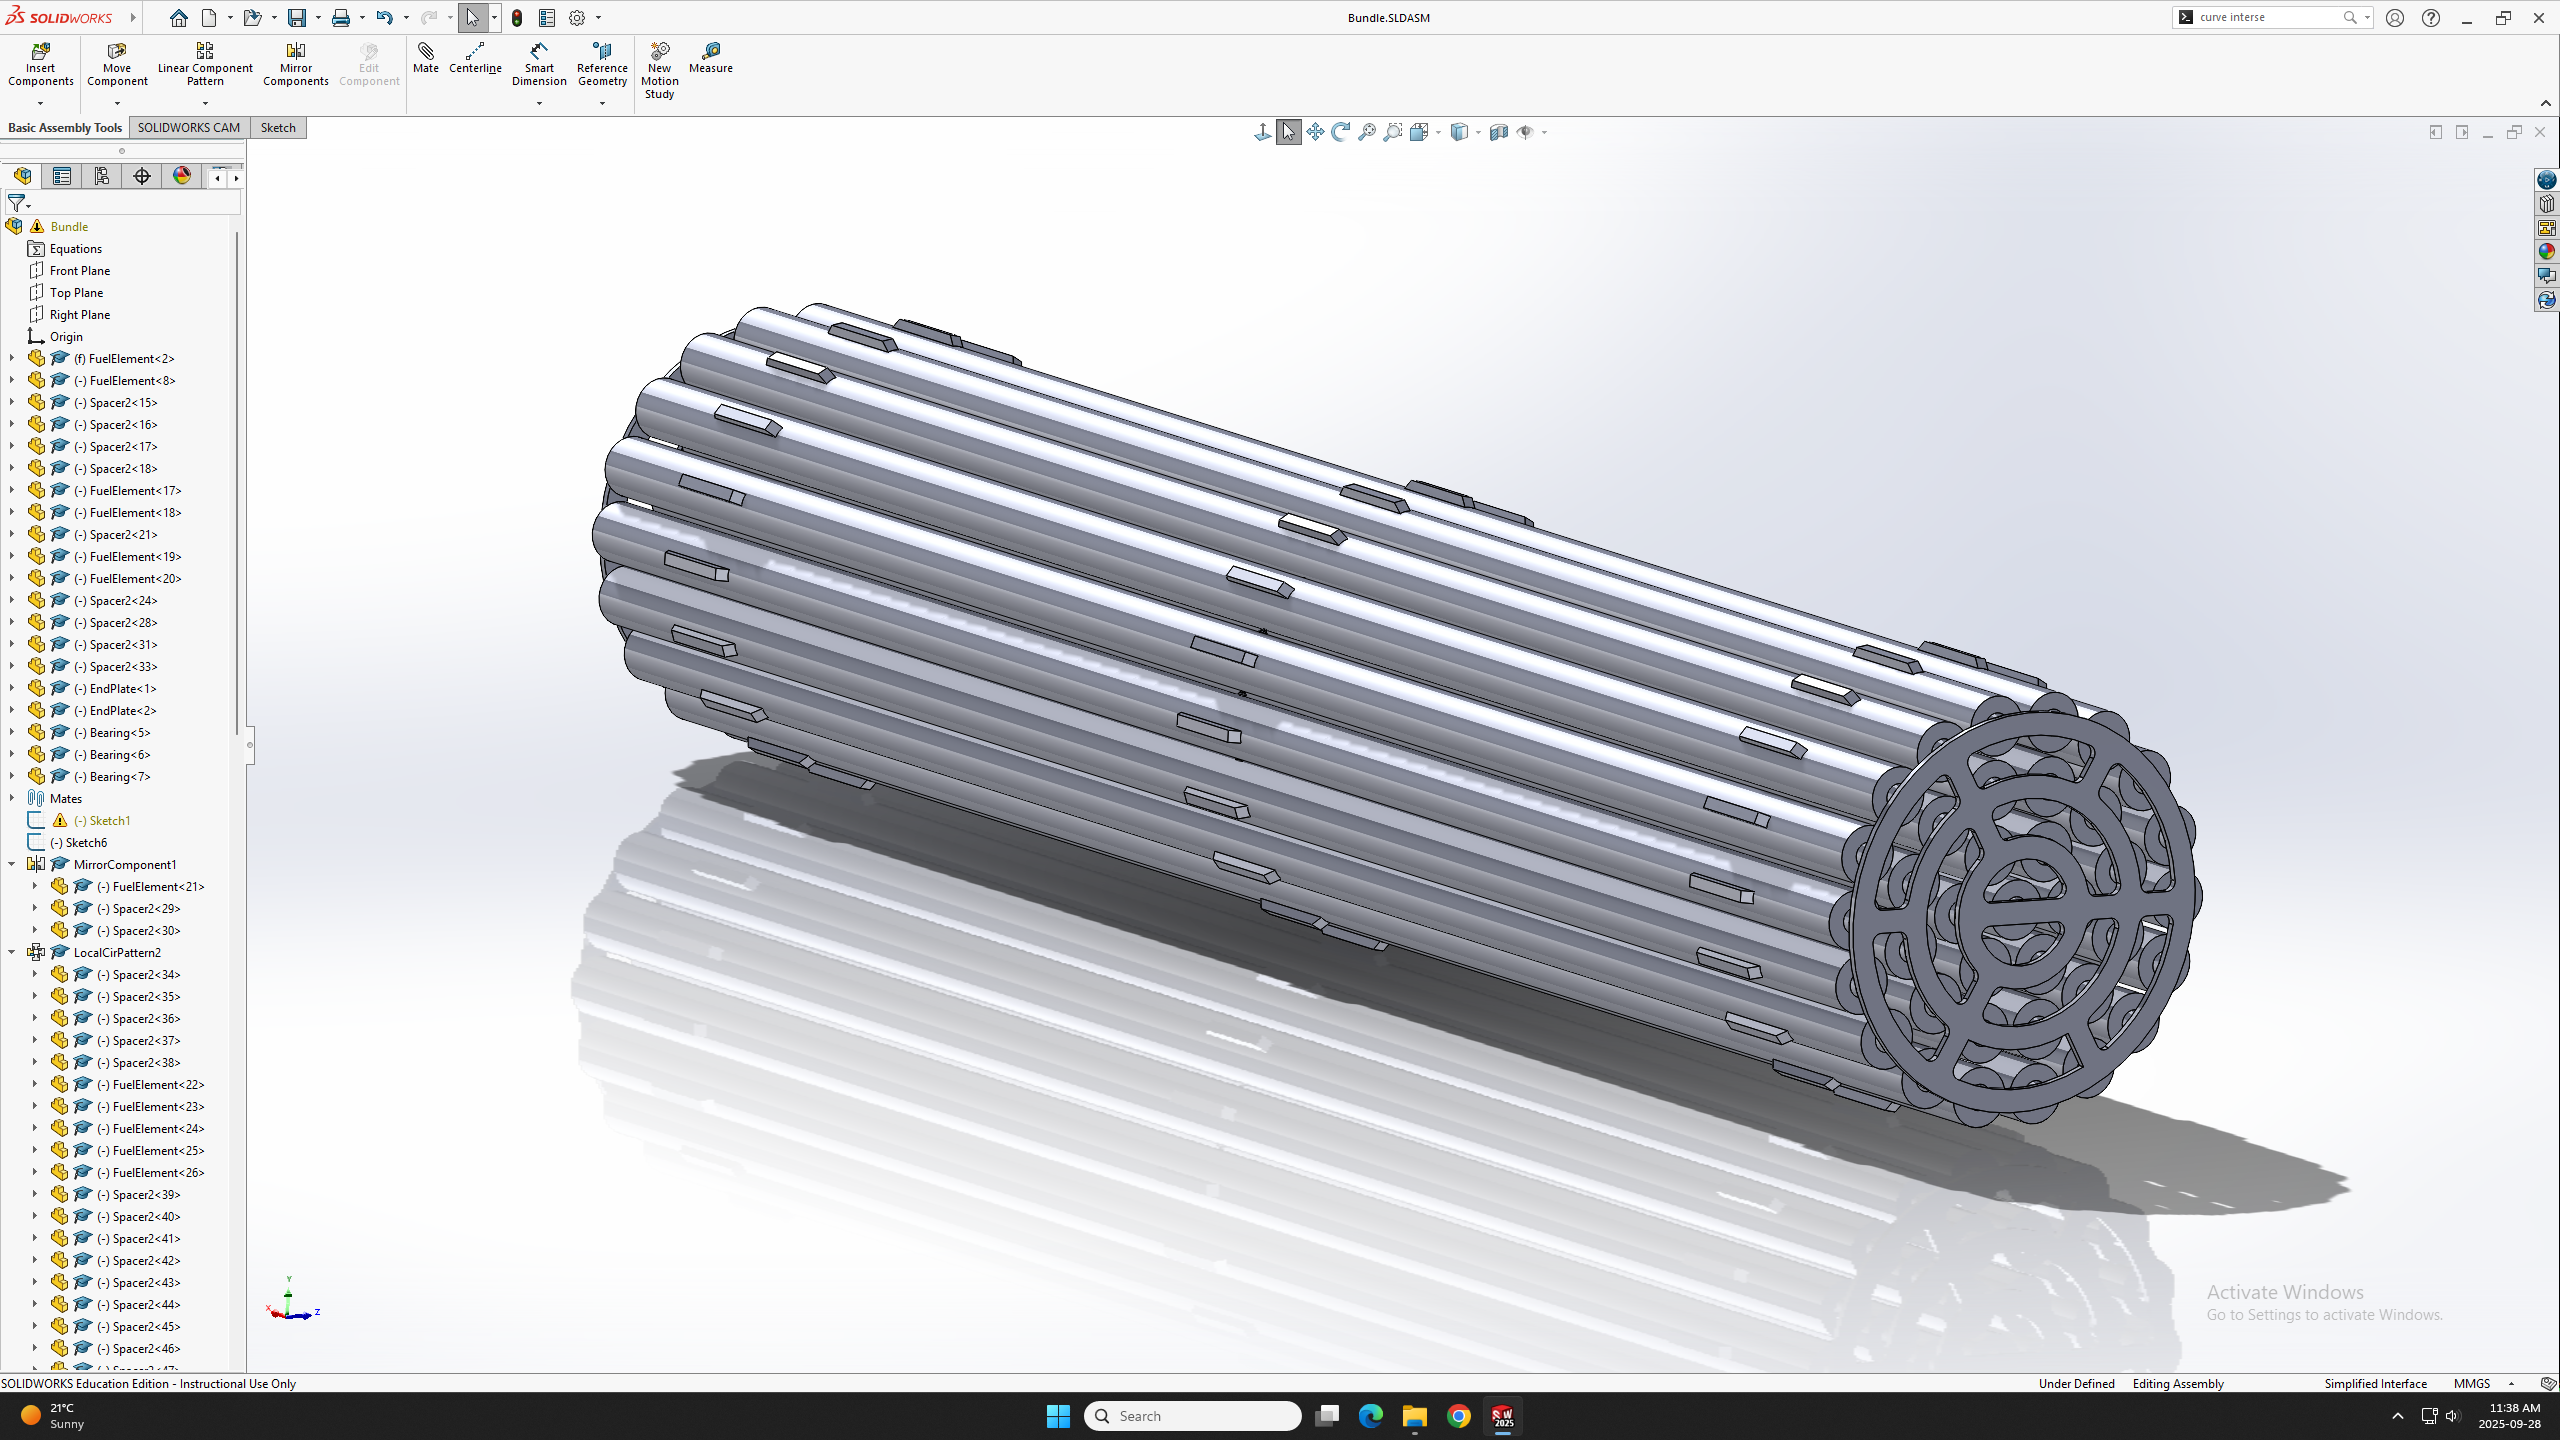
Side view of a 37 element fuel bundle, measurements gathered and estimated from the AECL Lectures on Nuclear Power Symposium provided on the CANTEACH site.
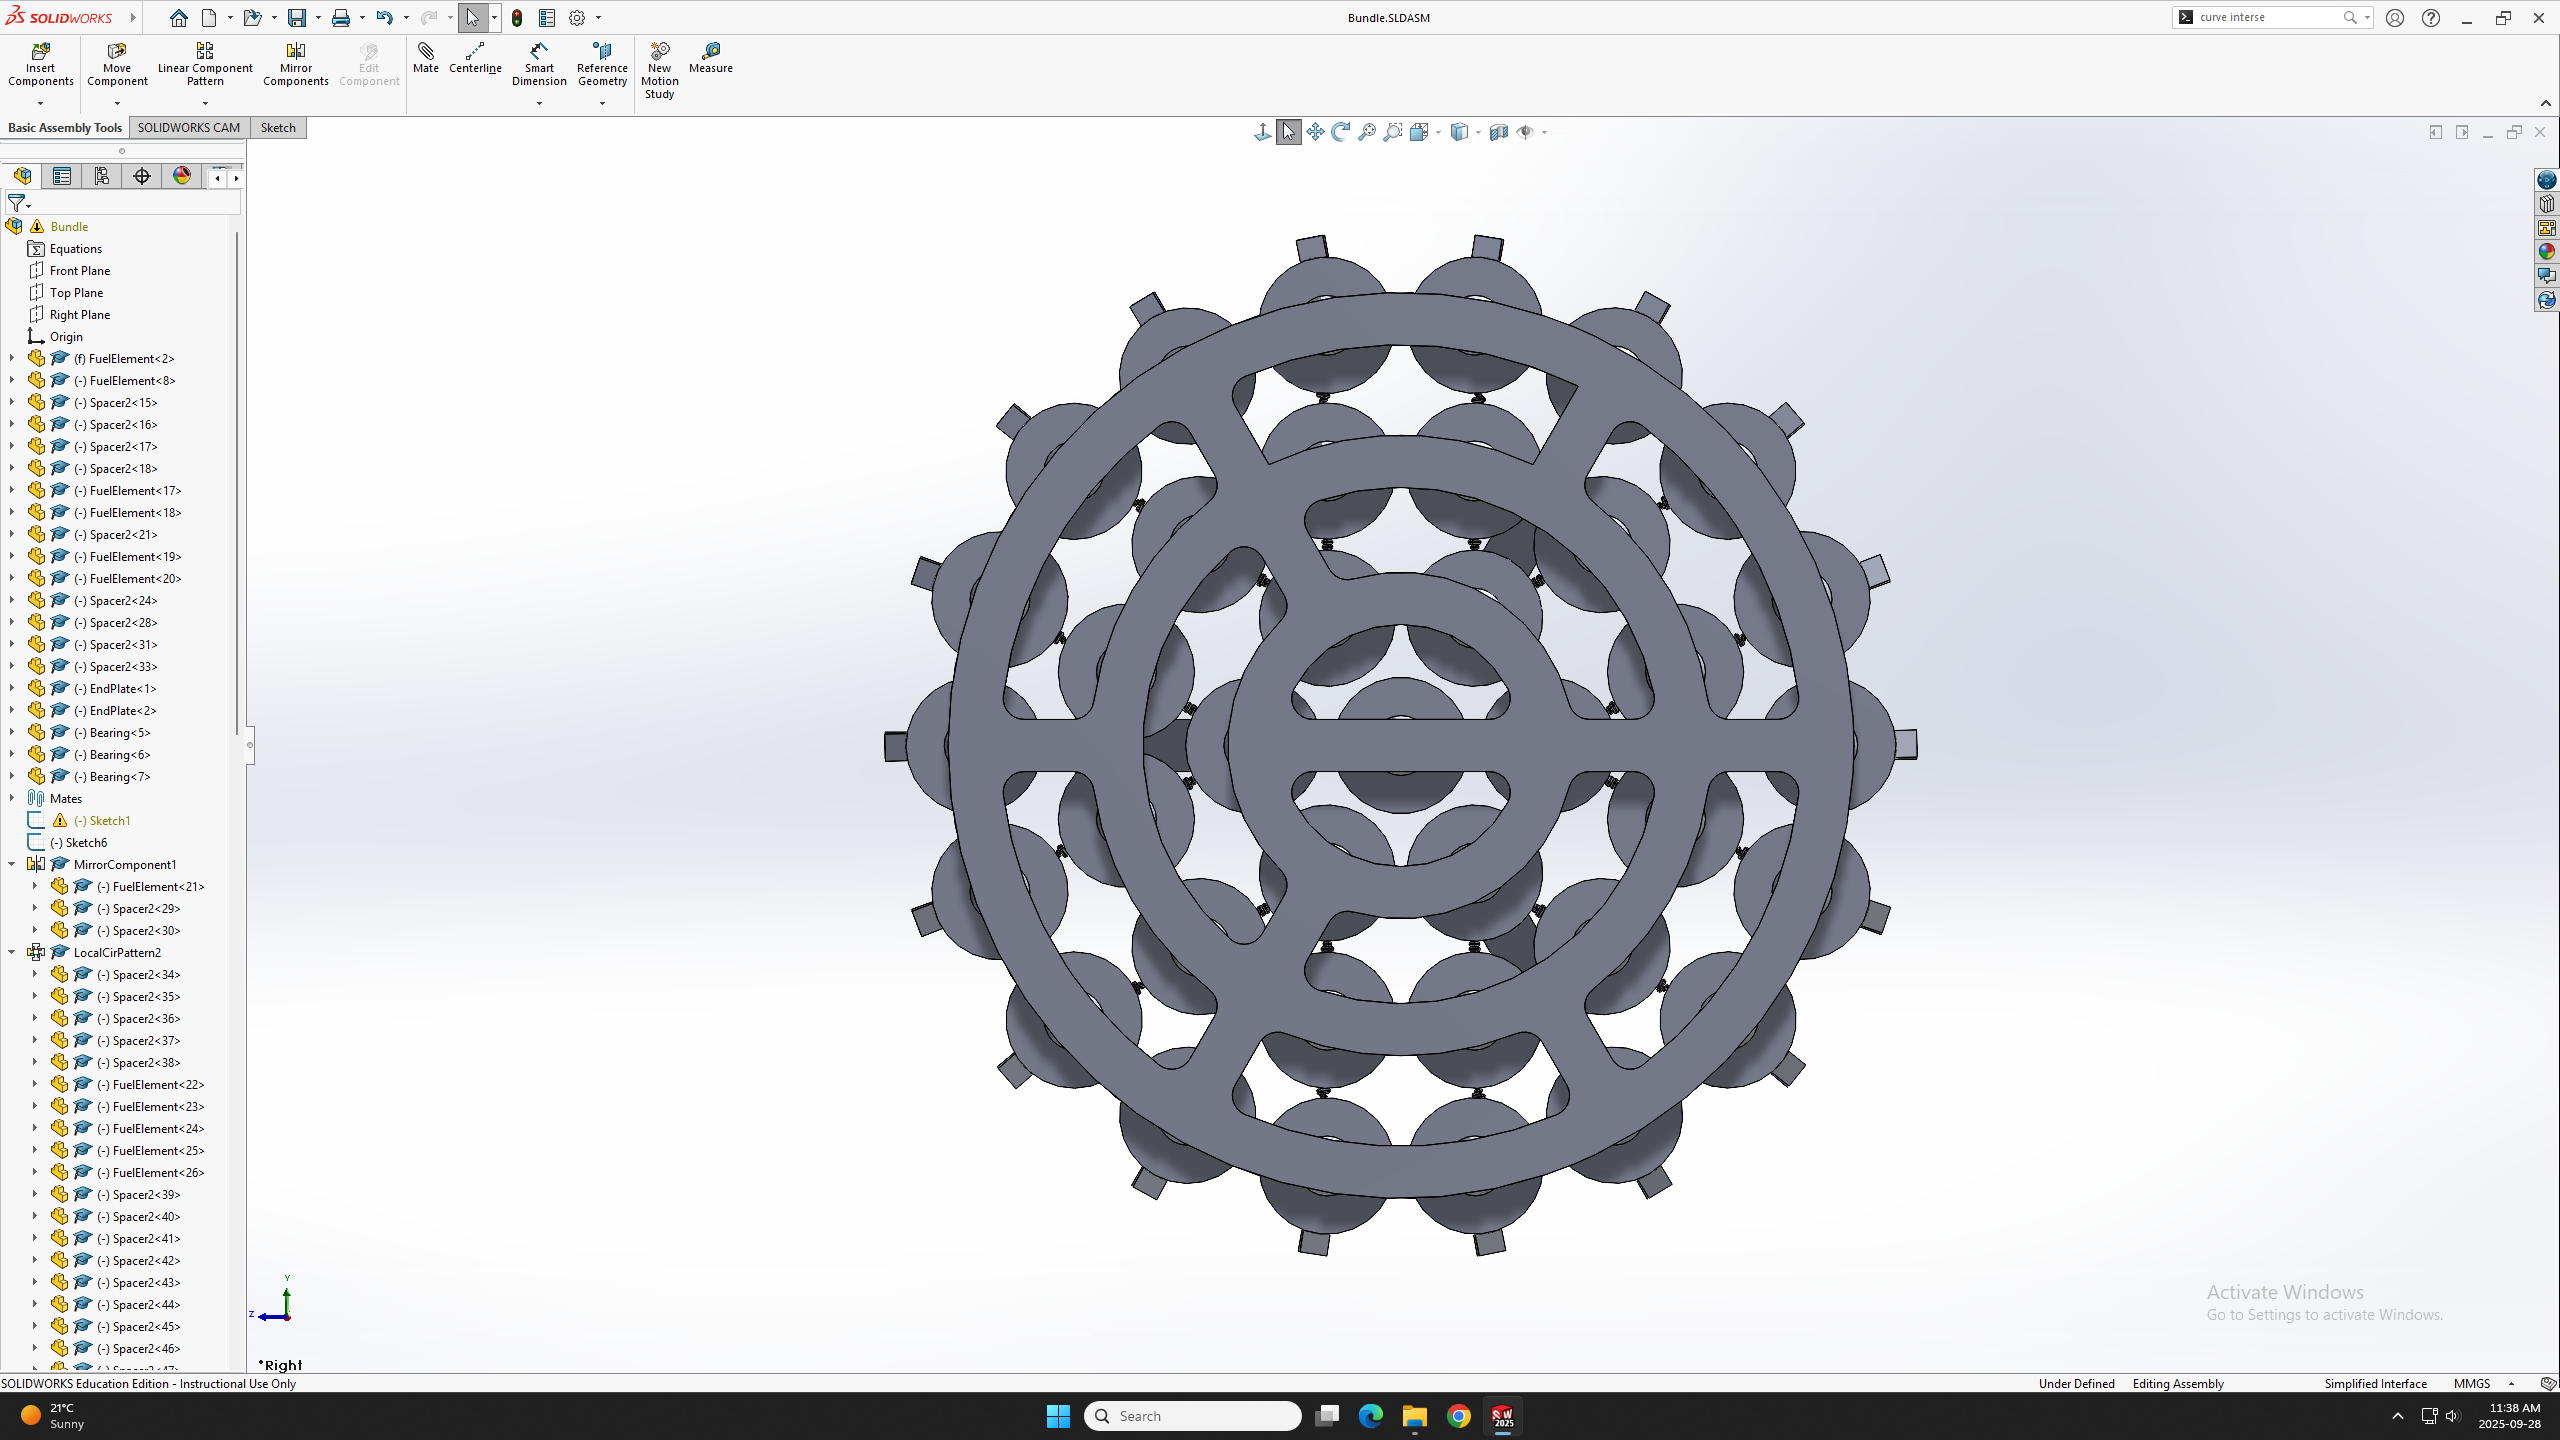
Front view of a 37 element fuel bundle, measurements gathered and estimated from the AECL Lectures on Nuclear Power Symposium provided on the CANTEACH site.
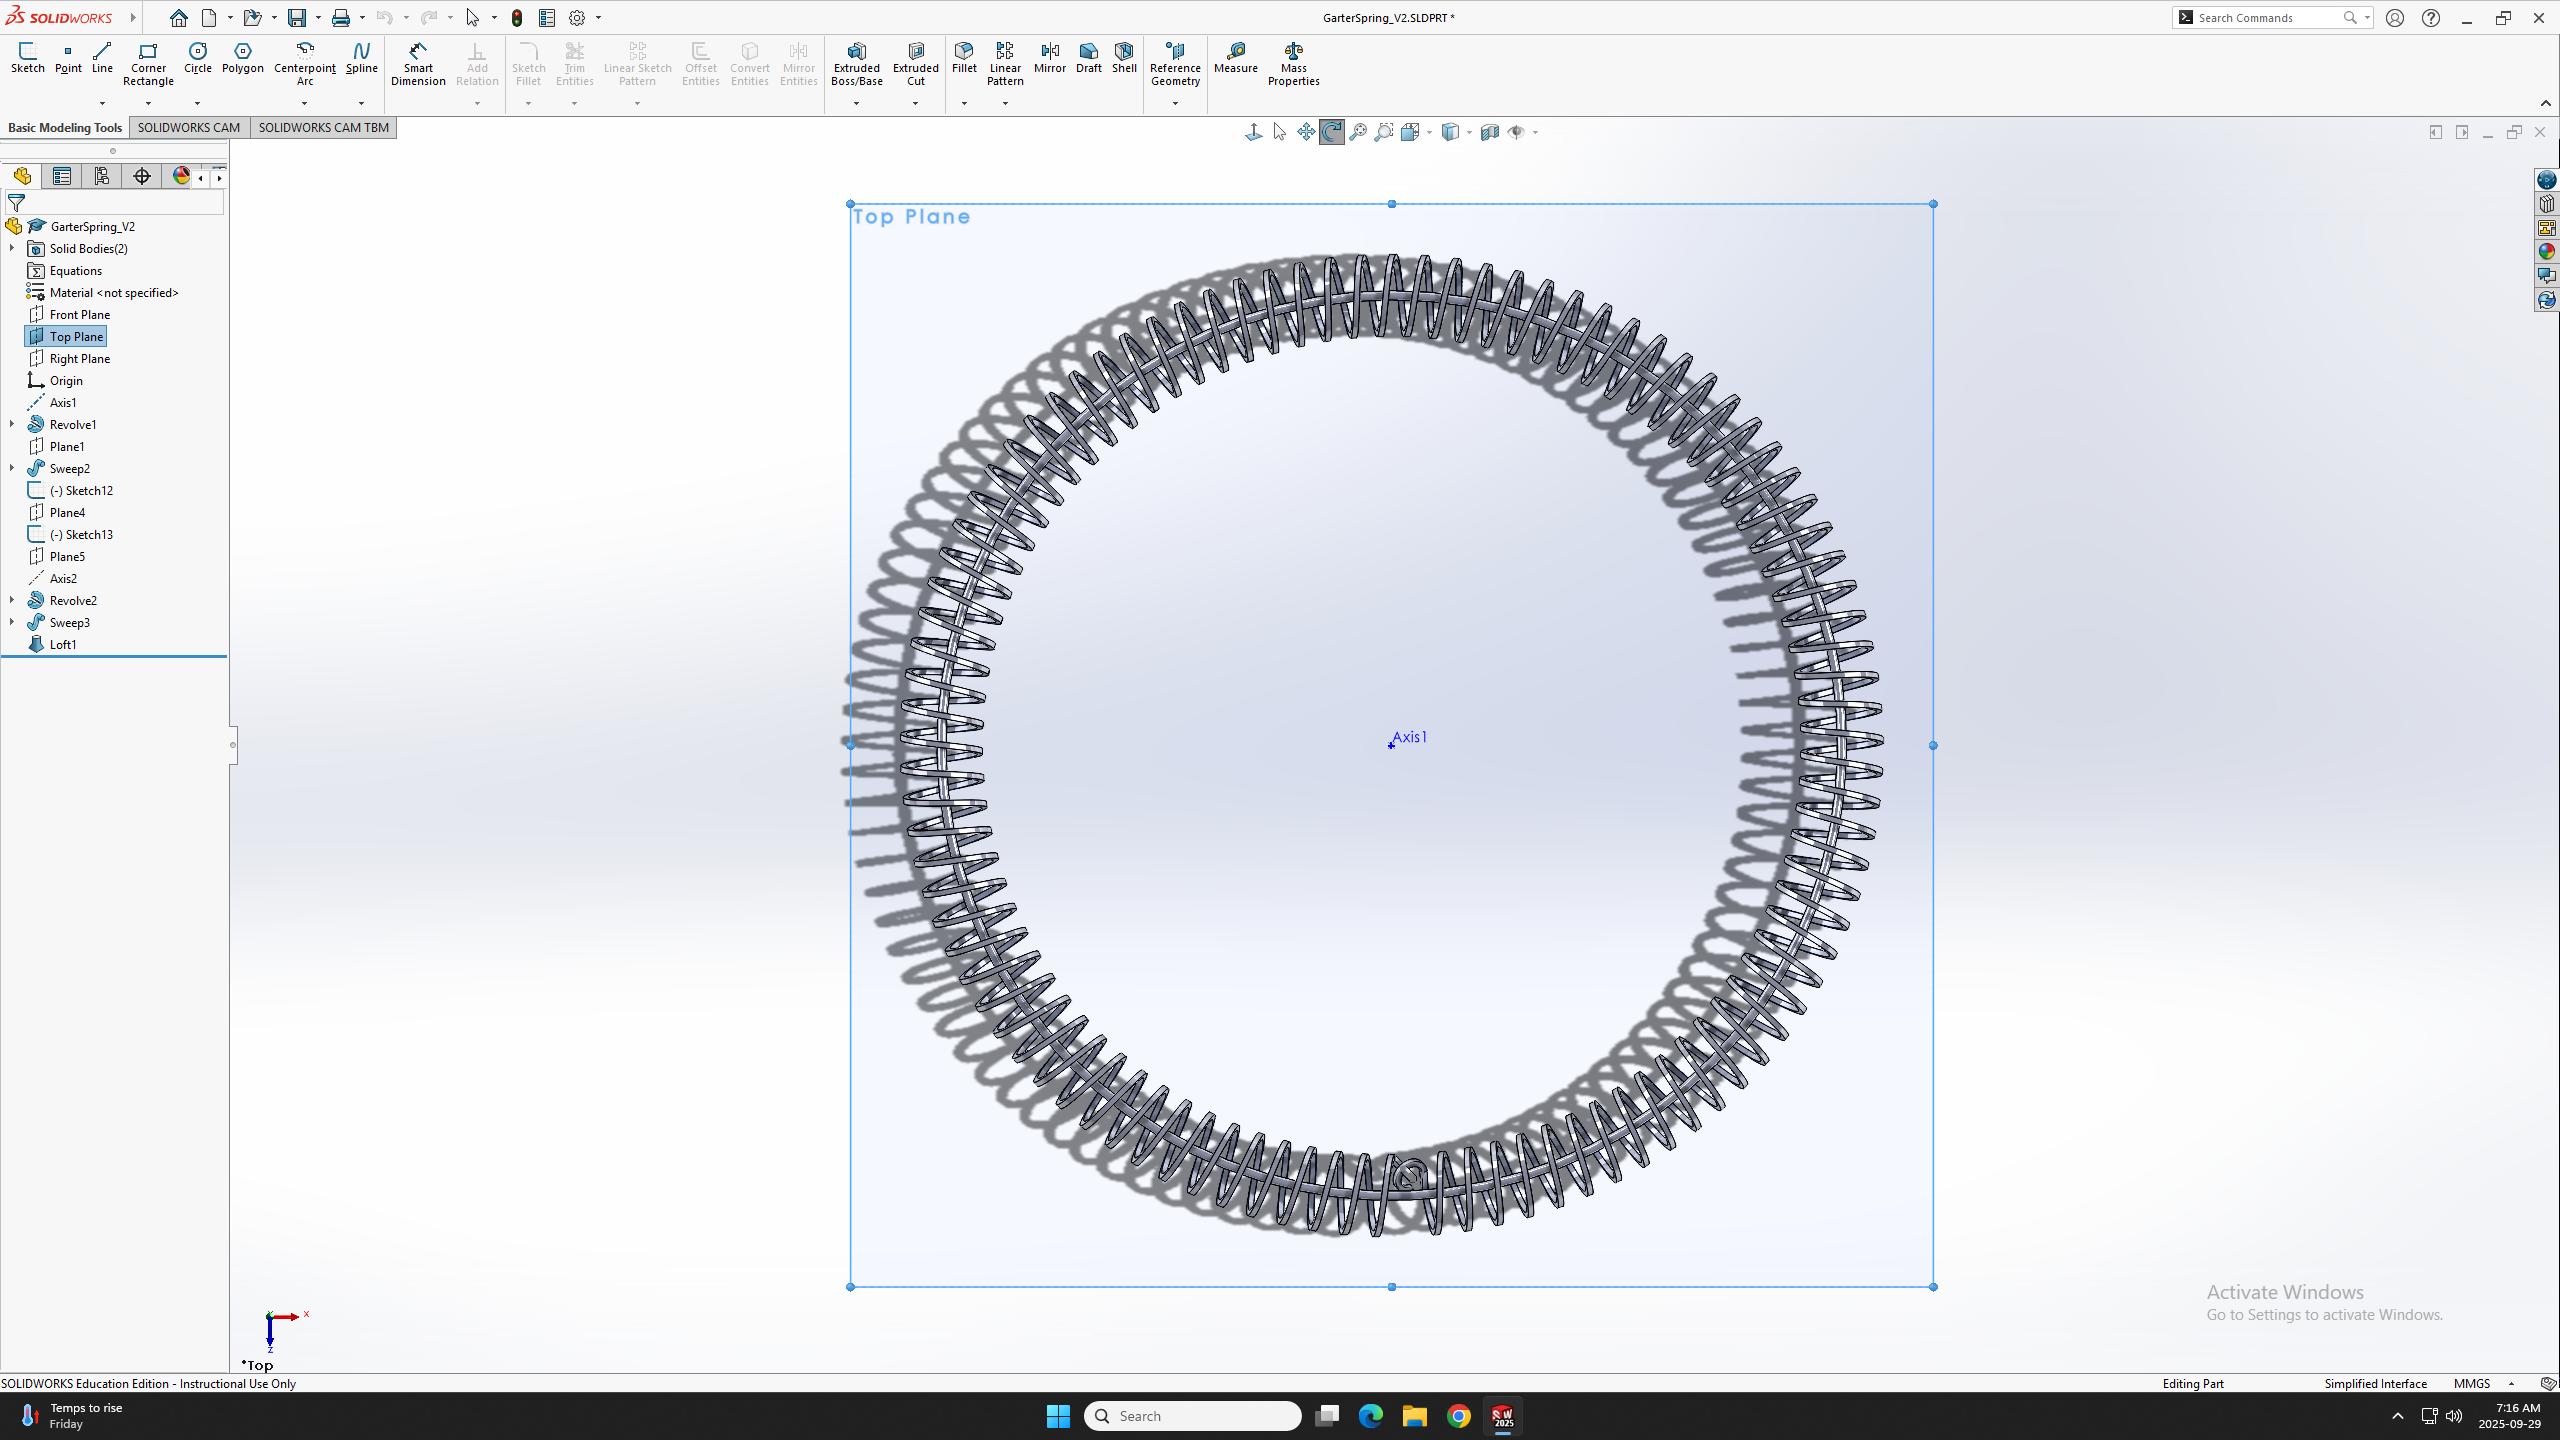
Model of the garter spring separating the pressure and calandria tube. Measurements gathered and estimated from CANDU Overview, Course 3.2 provided on the CANTEACH site.
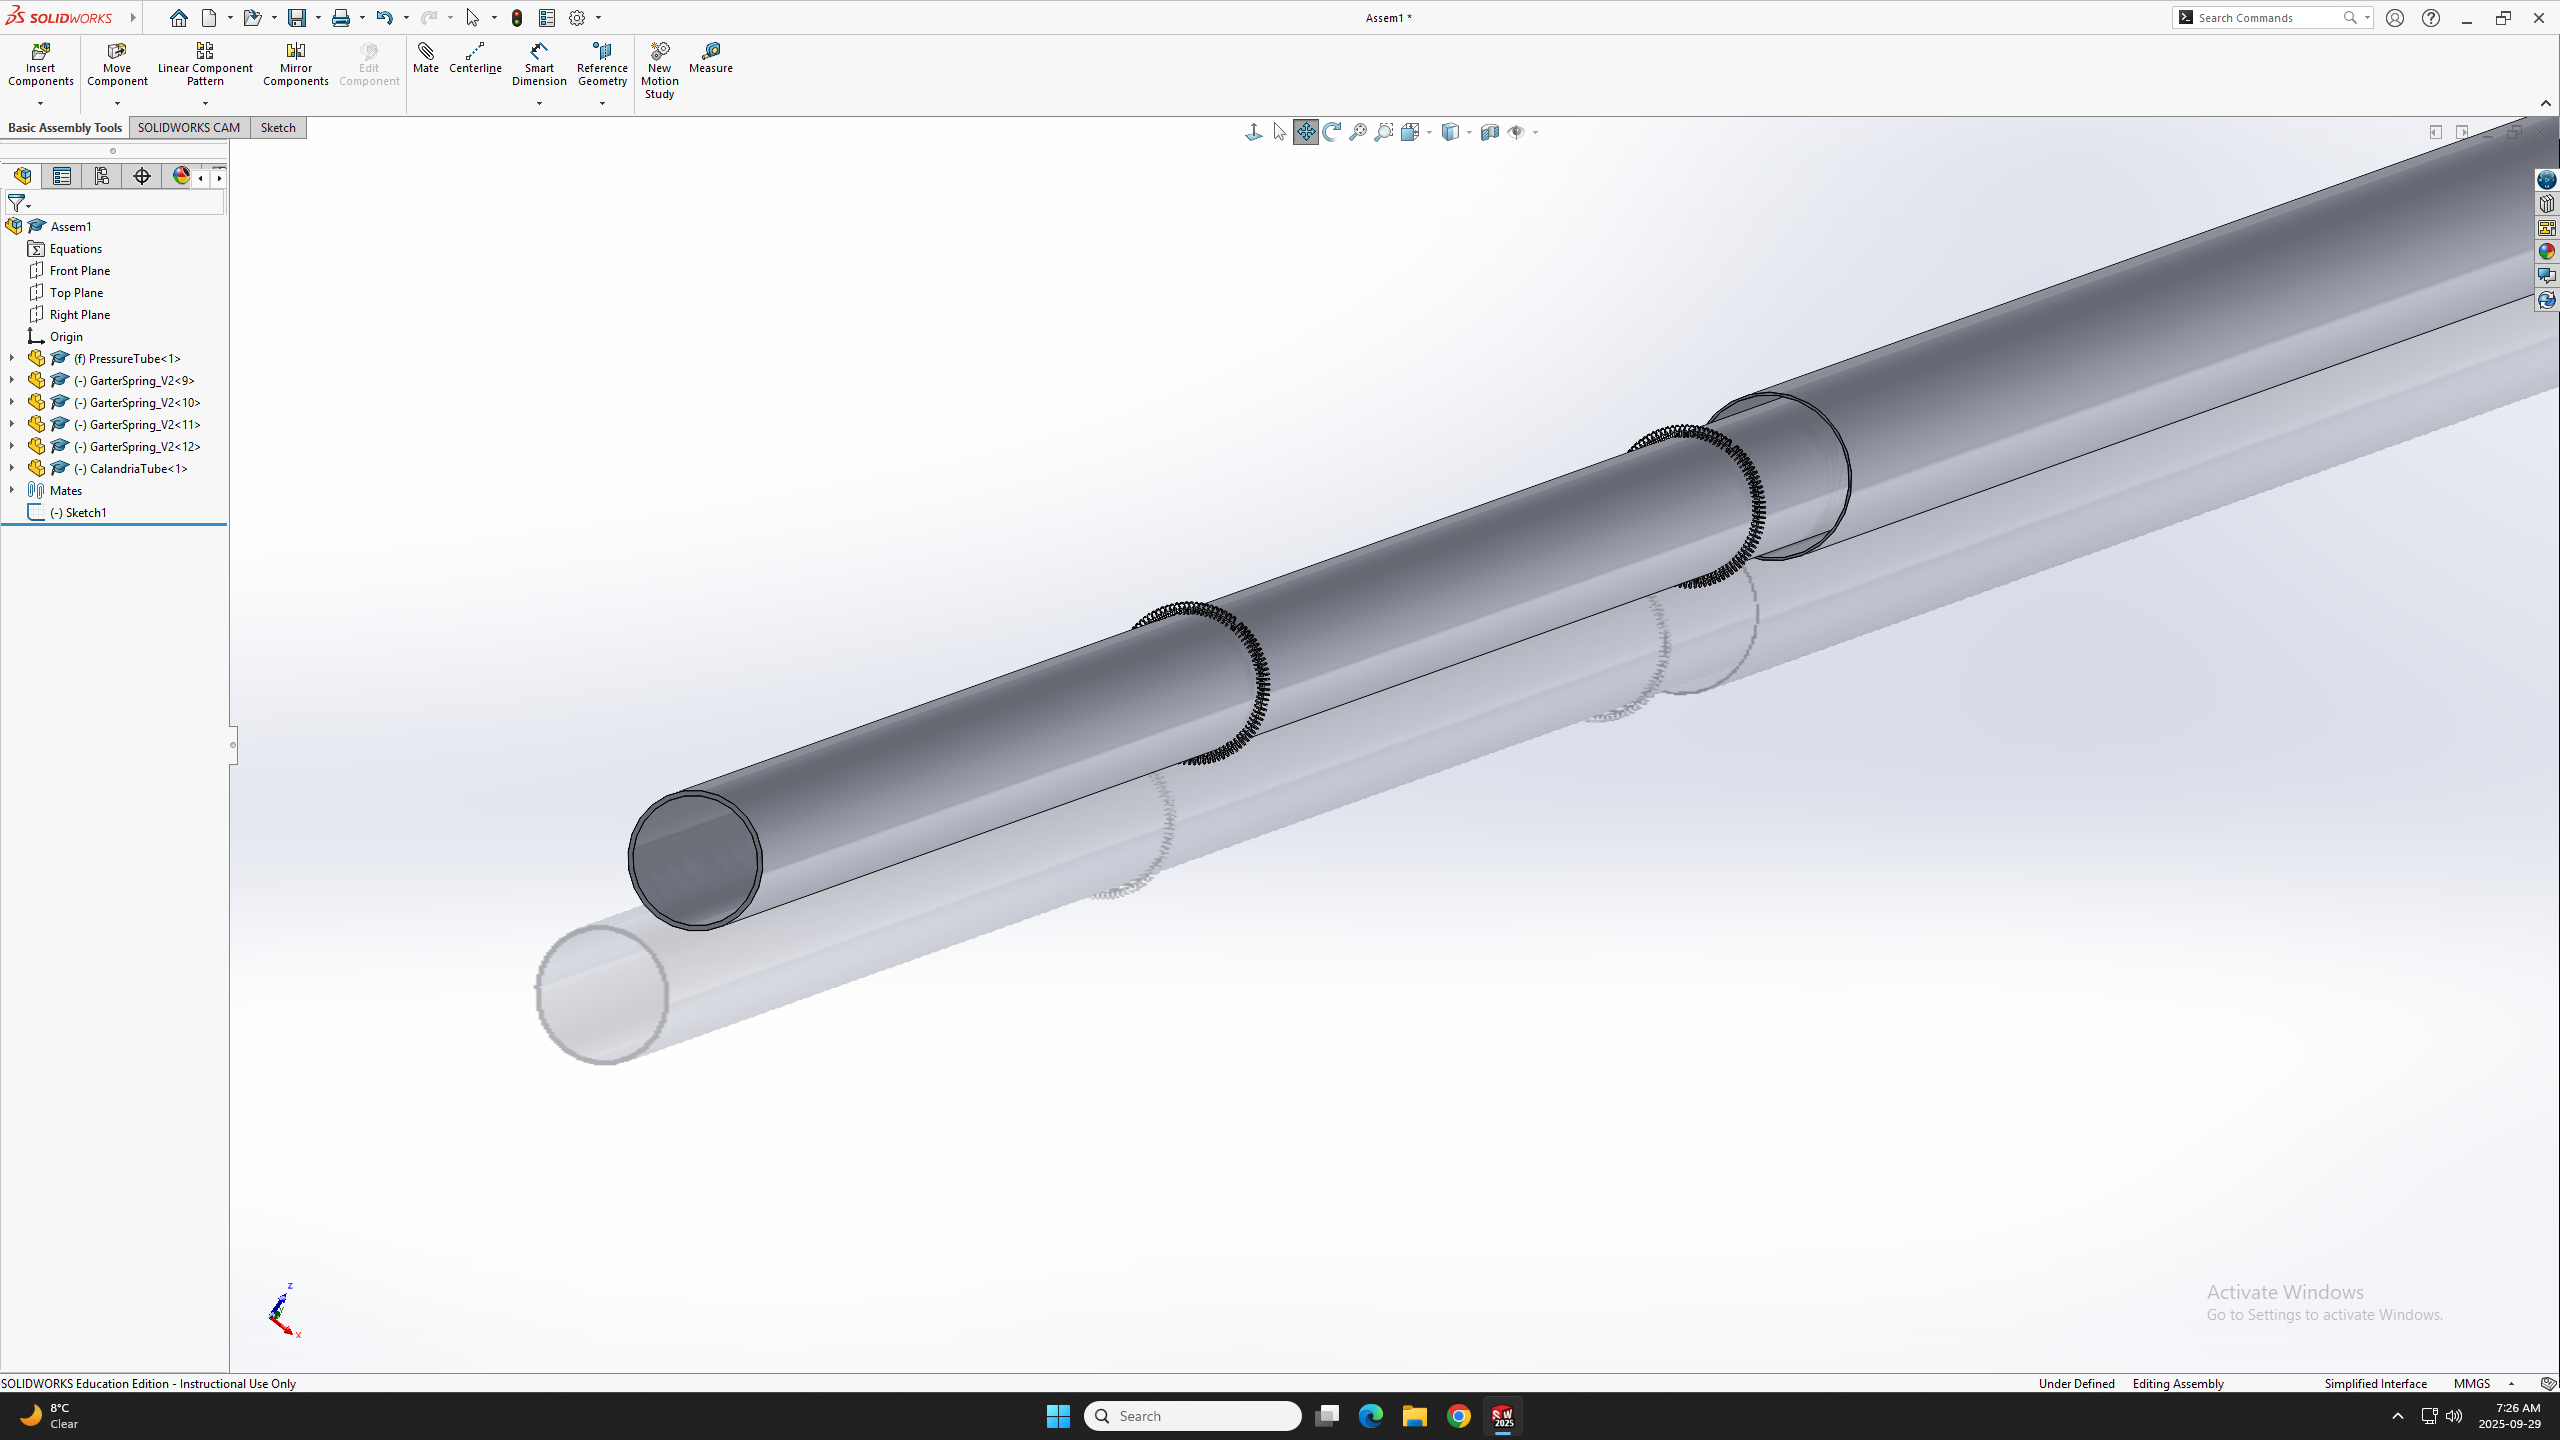
Assembly of a calandria tube, showing the function of the garter spring to separate the inner and outer tubes. Measurements gathered and estimated from CANDU Overview, Course 3.2 provided on the CANTEACH site.

Model of an annulus bellow, moderating the pressure of the annulus gas. Measurements estimated from Thorburn Flex | Serving The Nuclear Industry
Green Infrastructure Map of Toronto (QGIS)
September 2025
A map combining four green infrastructure datasets in the Toronto region from Toronto's OpenData portal. The purpose of the map is to analyze progress by the government towards green initiatives and compare areas of high and low progress. Renewable energy installations (2024) and pollination gardens (2025) which are symbolized by the size of the installation/garden for the marker, green street implementations (2025) (such as bioswales and special drainage into green areas), as well as government-maintained electric vehicle chargers (2025) sized by the number of chargers. The map is divided into the Toronto neighbourhoods where the implementations are weighted and summed to produce the intensity of the green areas and show the green development of the area by the government.
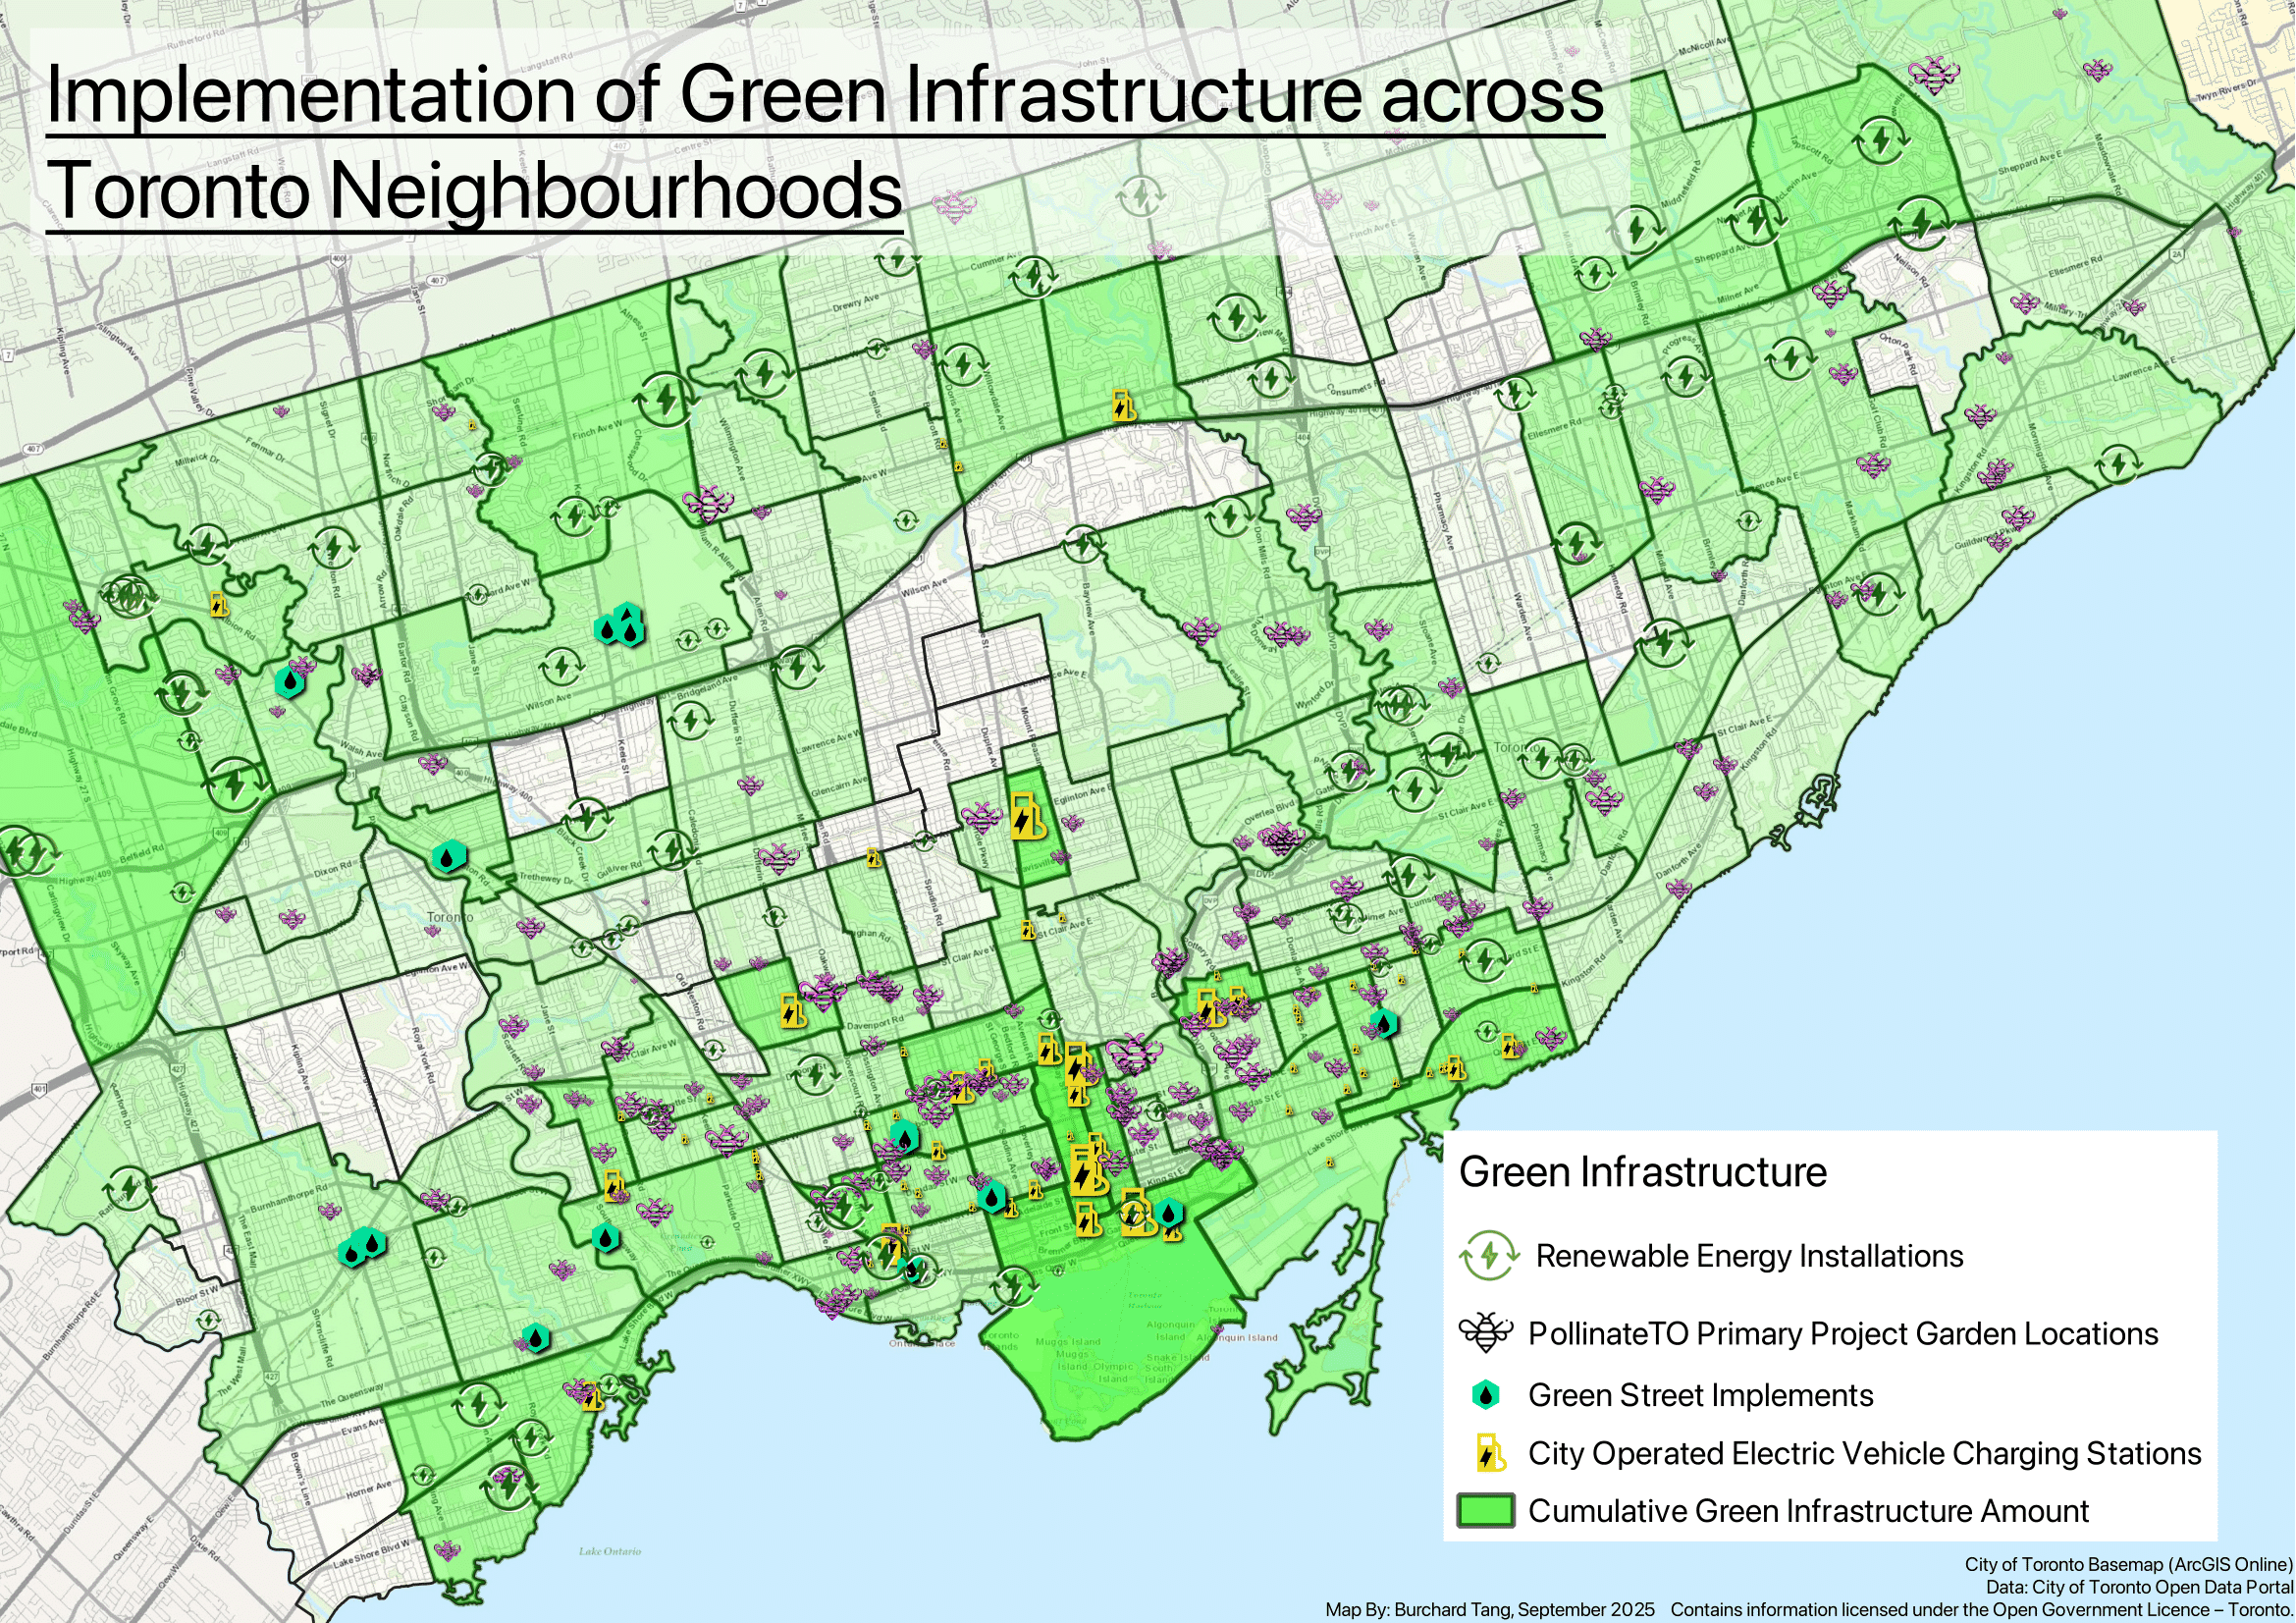
Map of Toronto labeled with green infrastructure made using QGIS.
Quantum Orbital Visualization (Octave)
August 2025
A 3D visualization of the time-independent Schrödinger equation solutions for electron orbitals using GNU Octave. By plotting probability clouds with scatter3, the project demonstrates how different quantum numbers shape electron orbitals. To build this, I read Jeffery R. Chasnov's lecture notes on differential equations available online, which include a section on the Schrödinger wave equation. This project enhanced my skills in mathematical modeling, numerical methods, and scientific visualization, while also strengthening my intuition for the physics behind quantum orbitals.
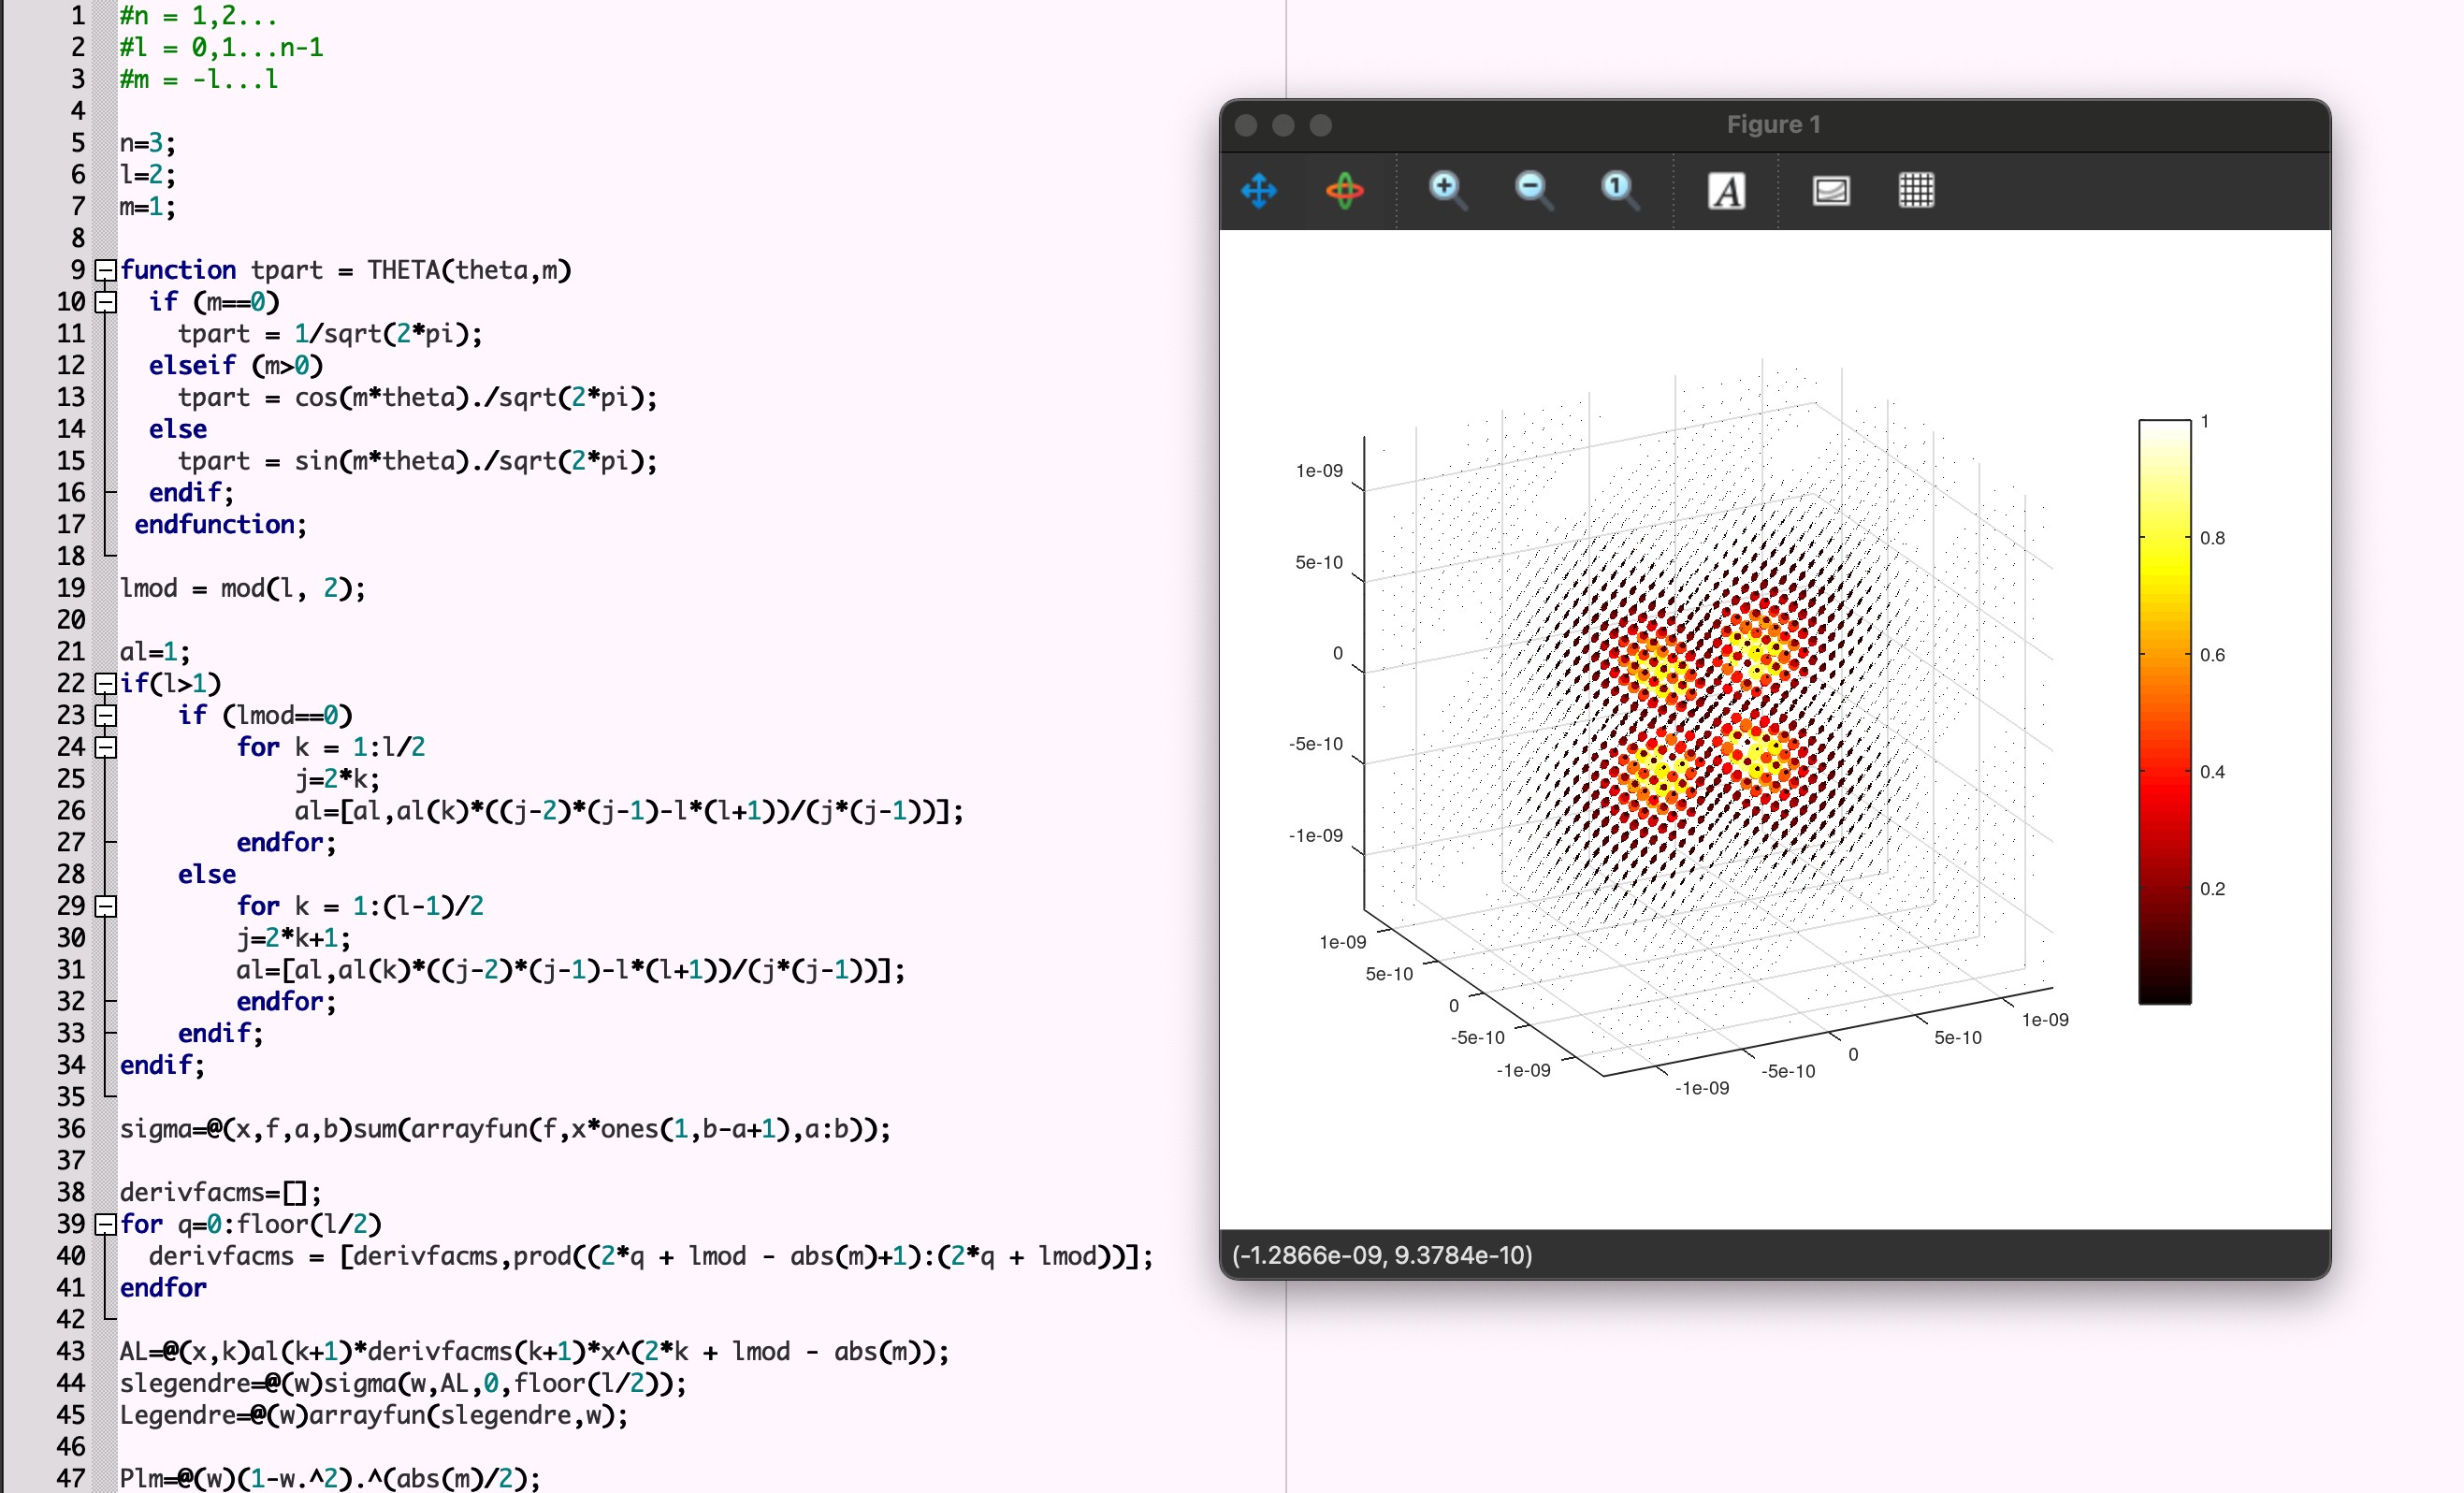
Visualization of the d₁ orbital as a 3D scatter plot.
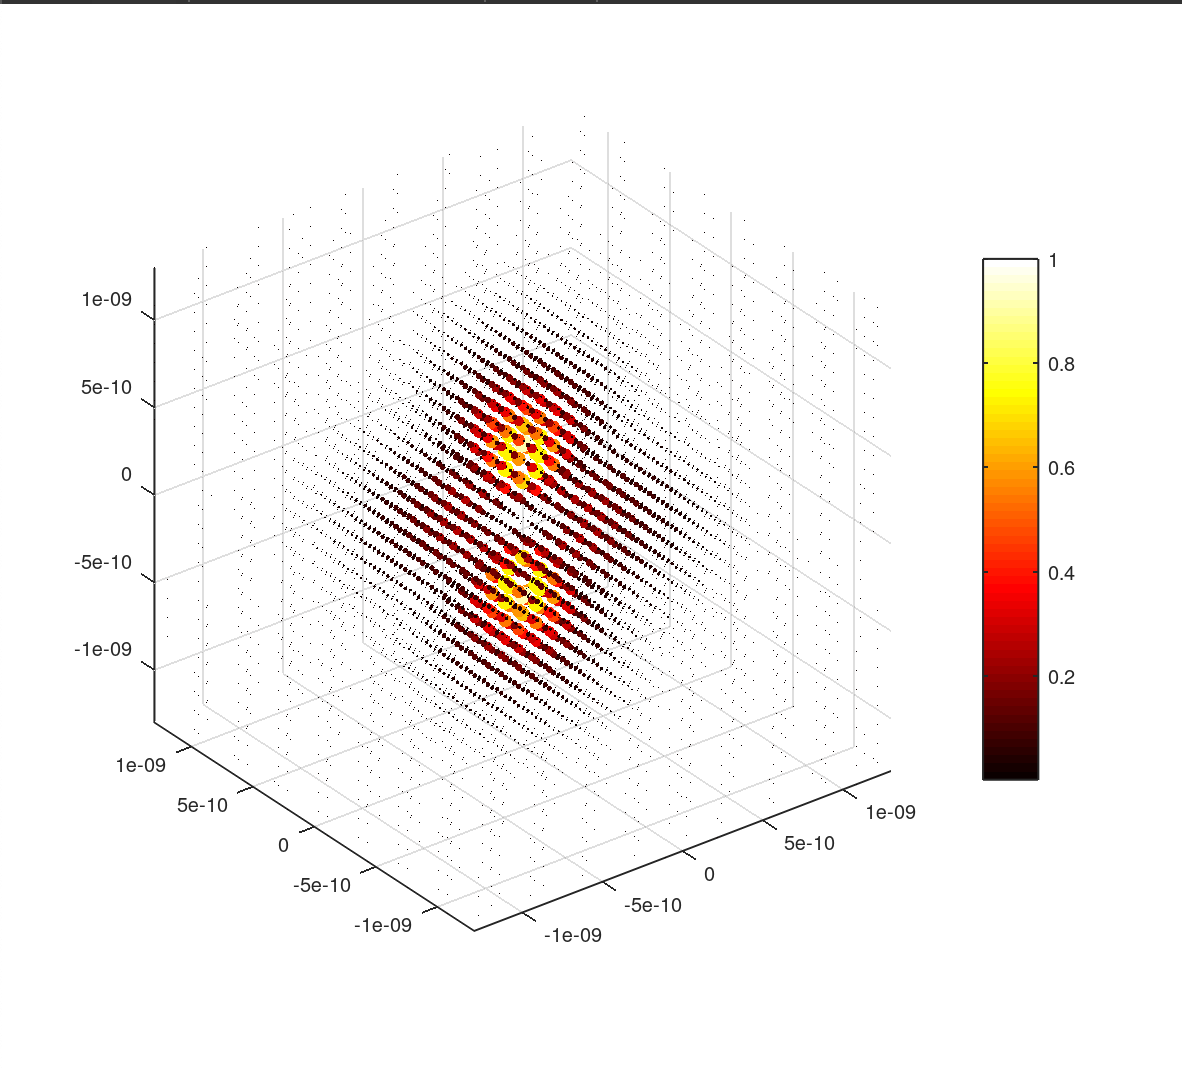
Visualization of the d₀ orbital distribution.
Game: Type-Casting (C#)
May - June 2025
Type-Casting is a fantasy-themed, bullet hell game where the player must type spell commands to cast attacks and survive against waves of hundreds of enemies. A large variety of content with 4 magical elements combined with spell modifiers to fight 10 types of monsters that shoot, dash, and fly as they hunt you.
Built in C# with MonoGame, the project demonstrates object-oriented programming principles, including inheritance and polymorphism to create different enemy and projectile types. Data structures such as linked lists, a quad-tree, sorting, and searching algorithms were implemented to efficiently manage hundreds of enemies with pathing and projectiles. Collision of projectiles with enemies and enemies with enemies were handled by building a quad-tree. Recursion was used to generate new winding caves and forest maps in each playthrough for unique experiences.
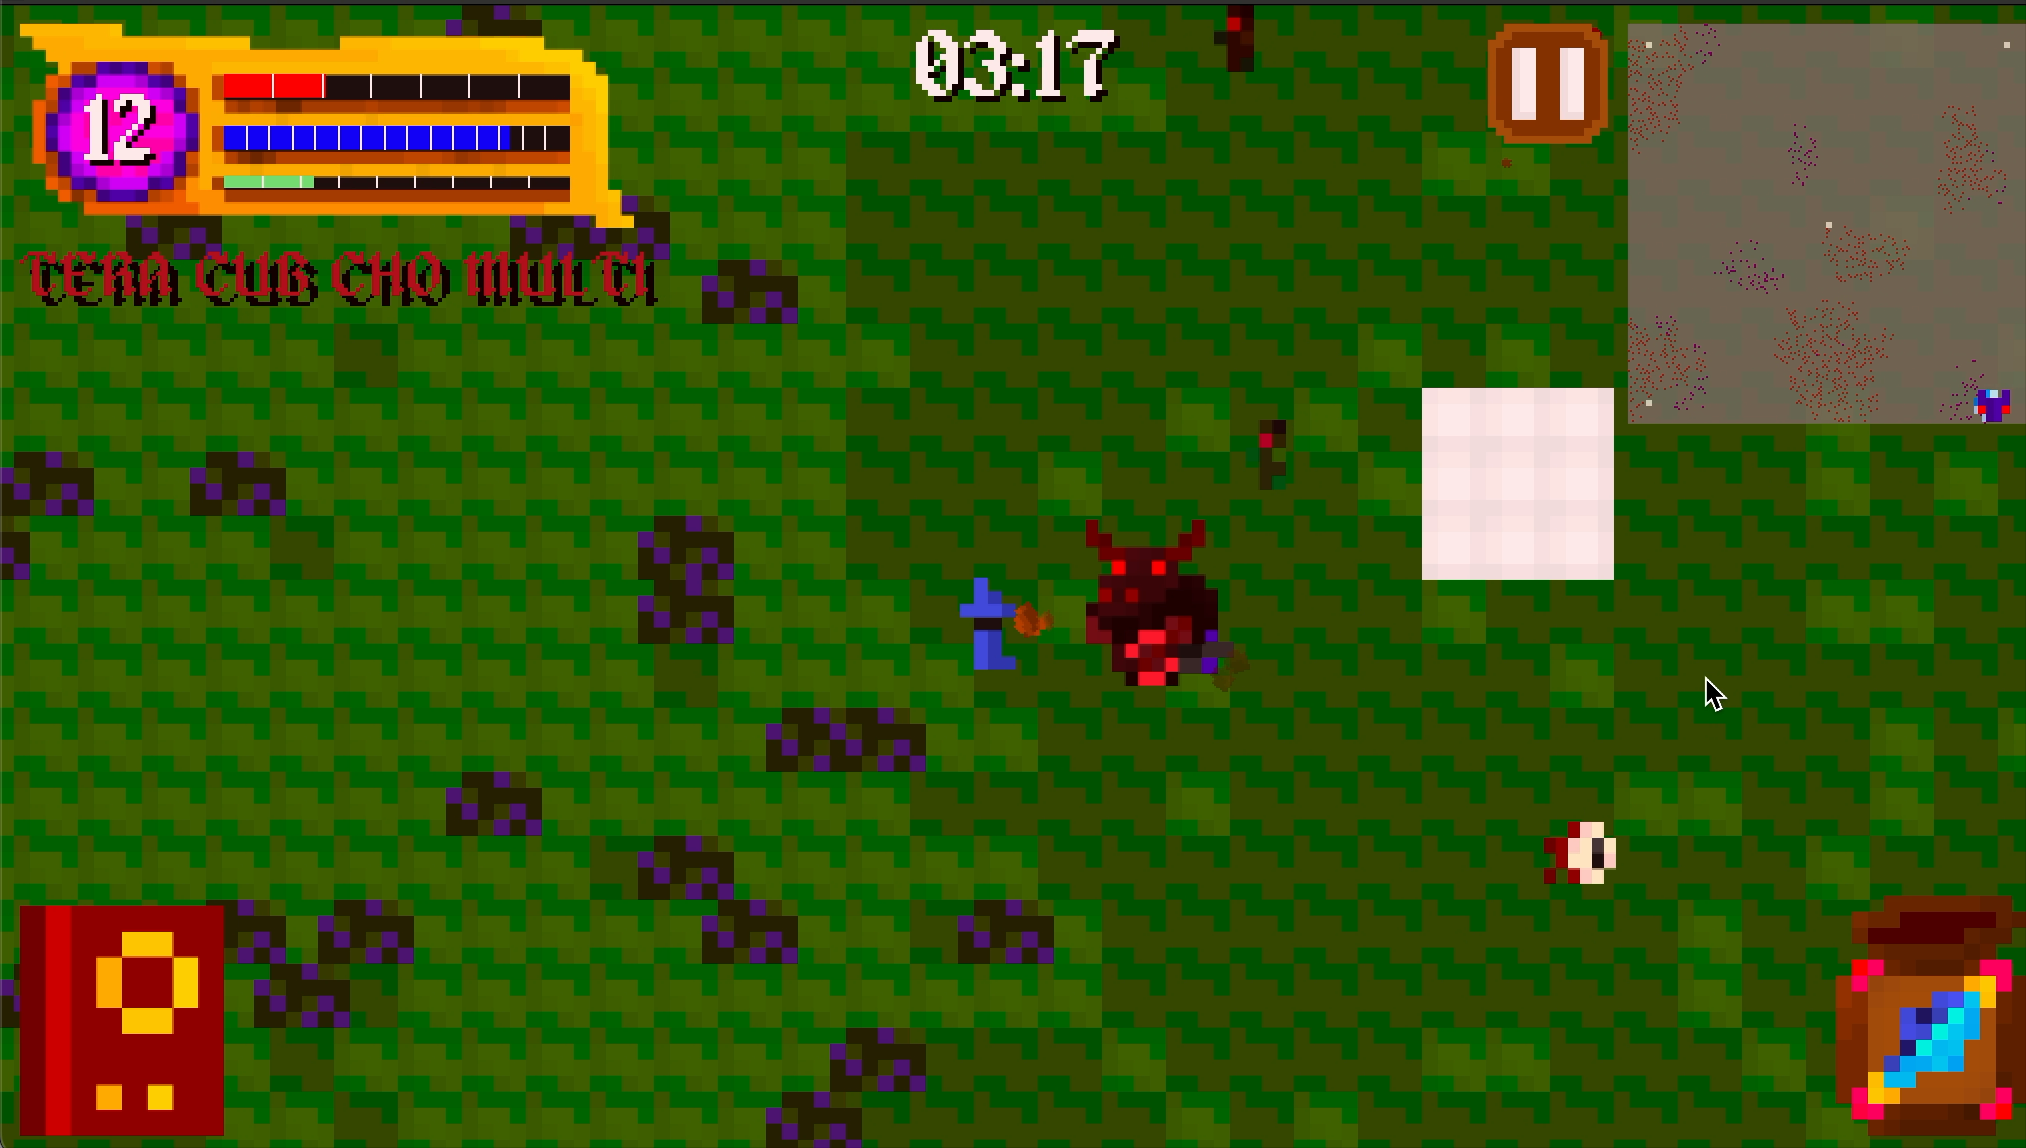
Gameplay of Type-Casting, featuring typed spells and enemy combat.
Speaking Engagement Organizer & Speaker
January 2024
Designed and coordinated a TED Talk–style assembly attended by 200+ junior students. The event featured senior students giving talks on topics such as passion in learning and dealing with mistakes. Teachers also gave talks about their professional journeys. I contributed both as an organizer and as a speaker, ensuring smooth logistics, clear communication with participants, and impactful delivery to the audience. The purpose of this event was to strengthen public speaking ability in students and to create a supportive environment for juniors. From feedback forms, the audience particularly enjoyed hearing about their teachers' backgrounds and I personally felt I developed my ability to communicate with others.
Extra
Favourite Desmos Selections
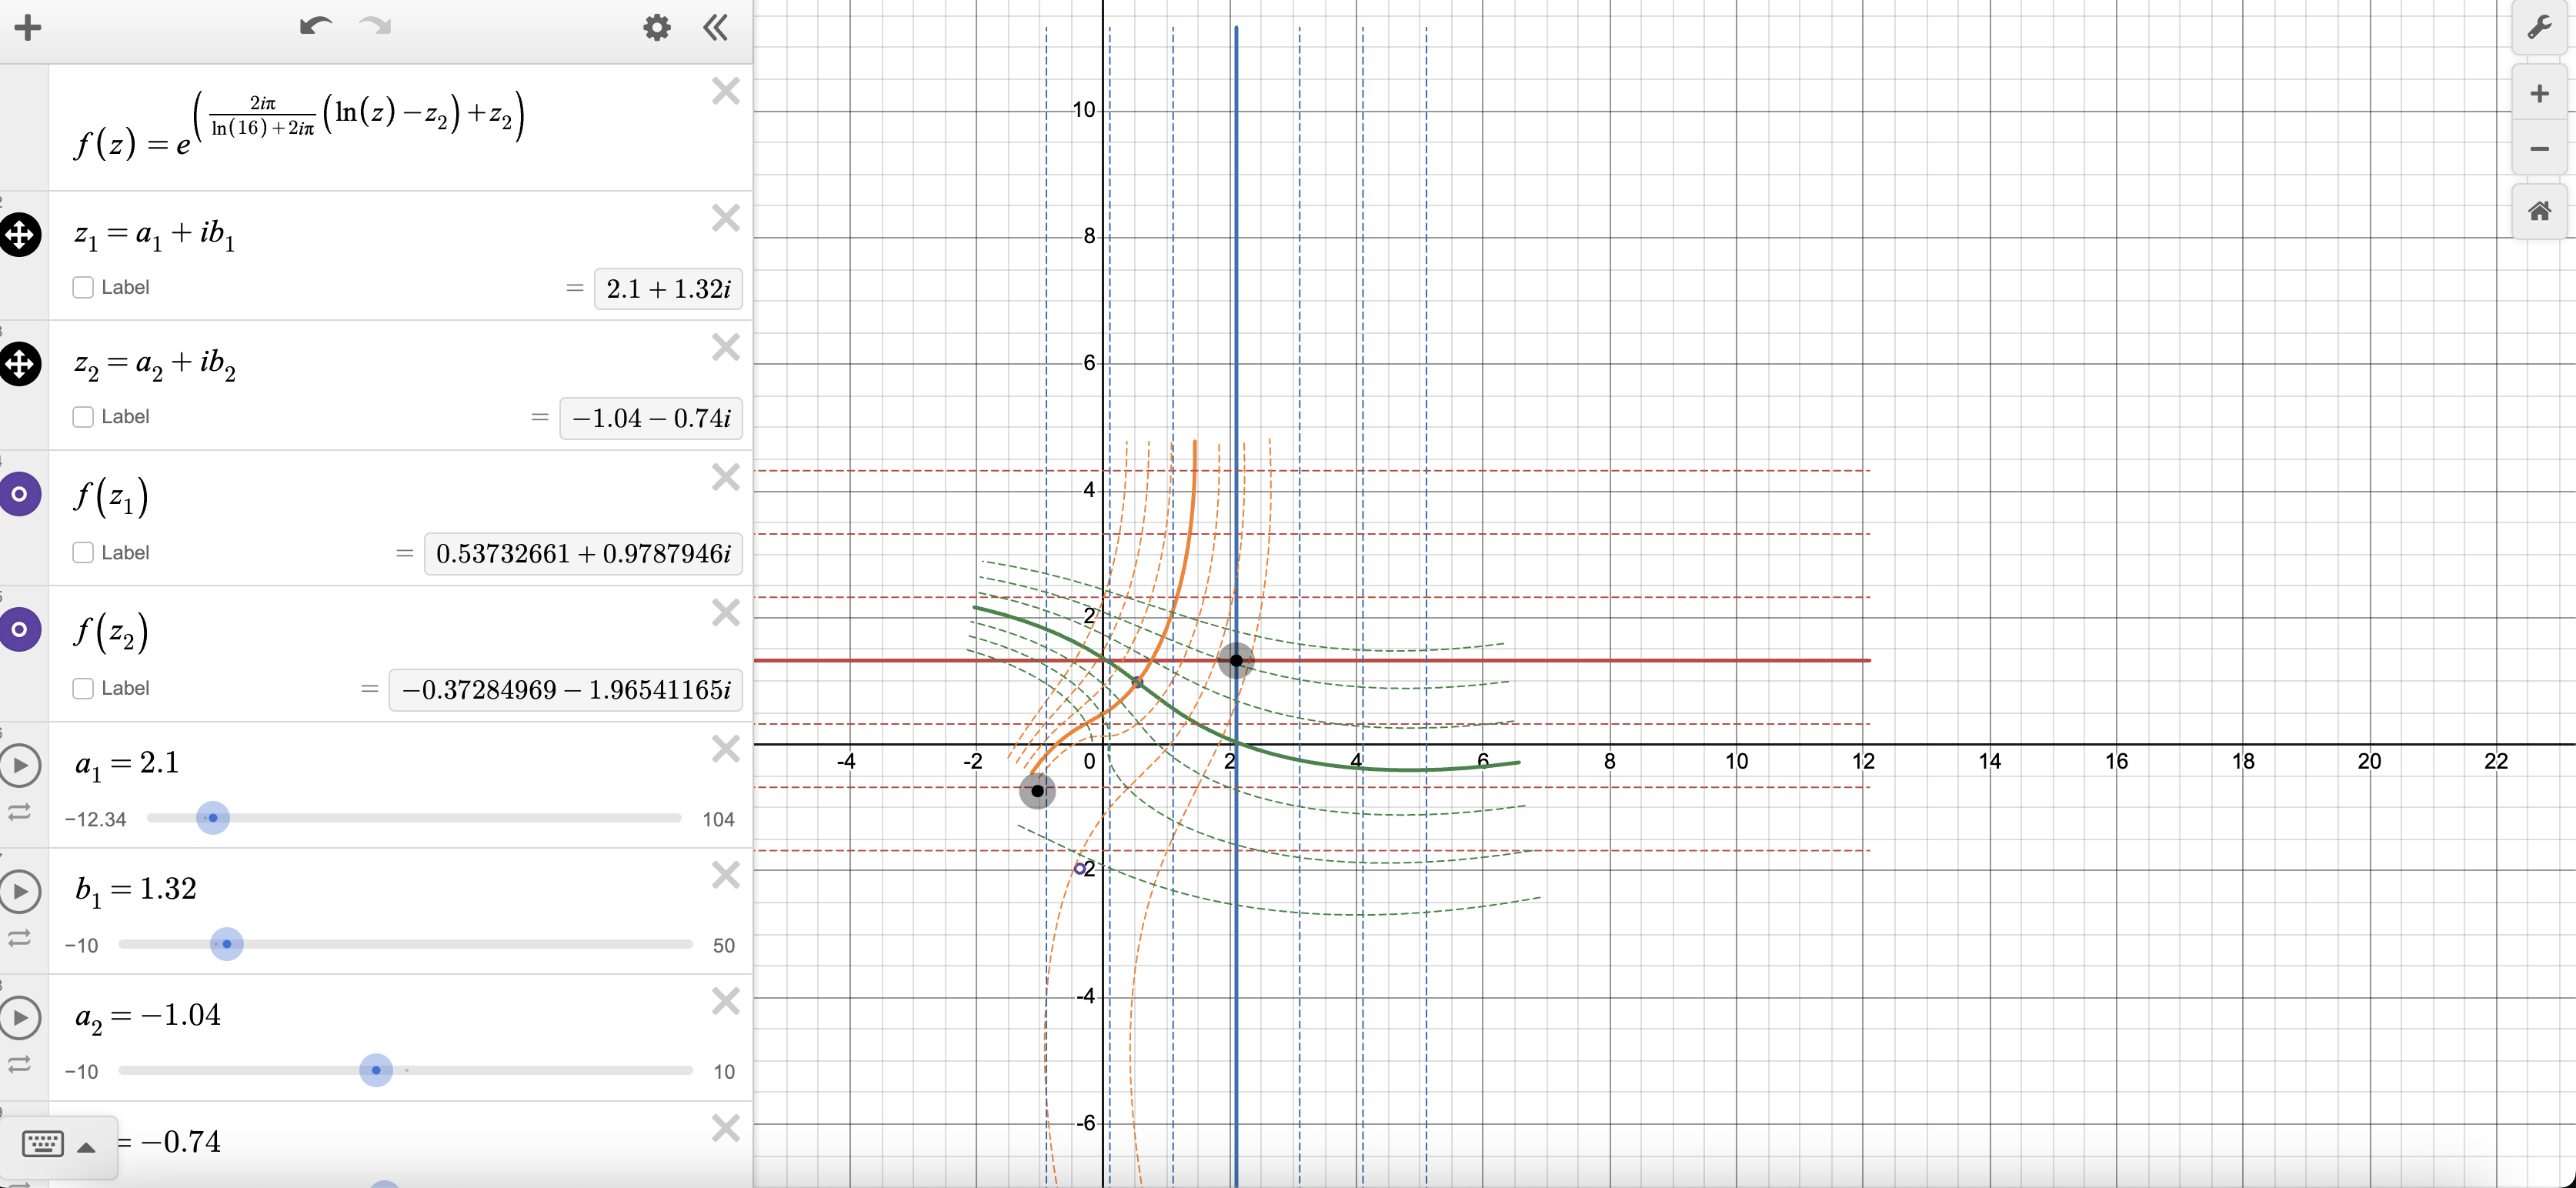
Whenever I learn a mathematical or physics concept, it often helps me to graph it in Desmos so I can visualize it better and develop an understanding. Quite often, I would become fixated on a problem and spend time at length on Desmos, so much so I would consider it a hobby. This behaviour has left me with numerous graphs, my favorites of the set below.
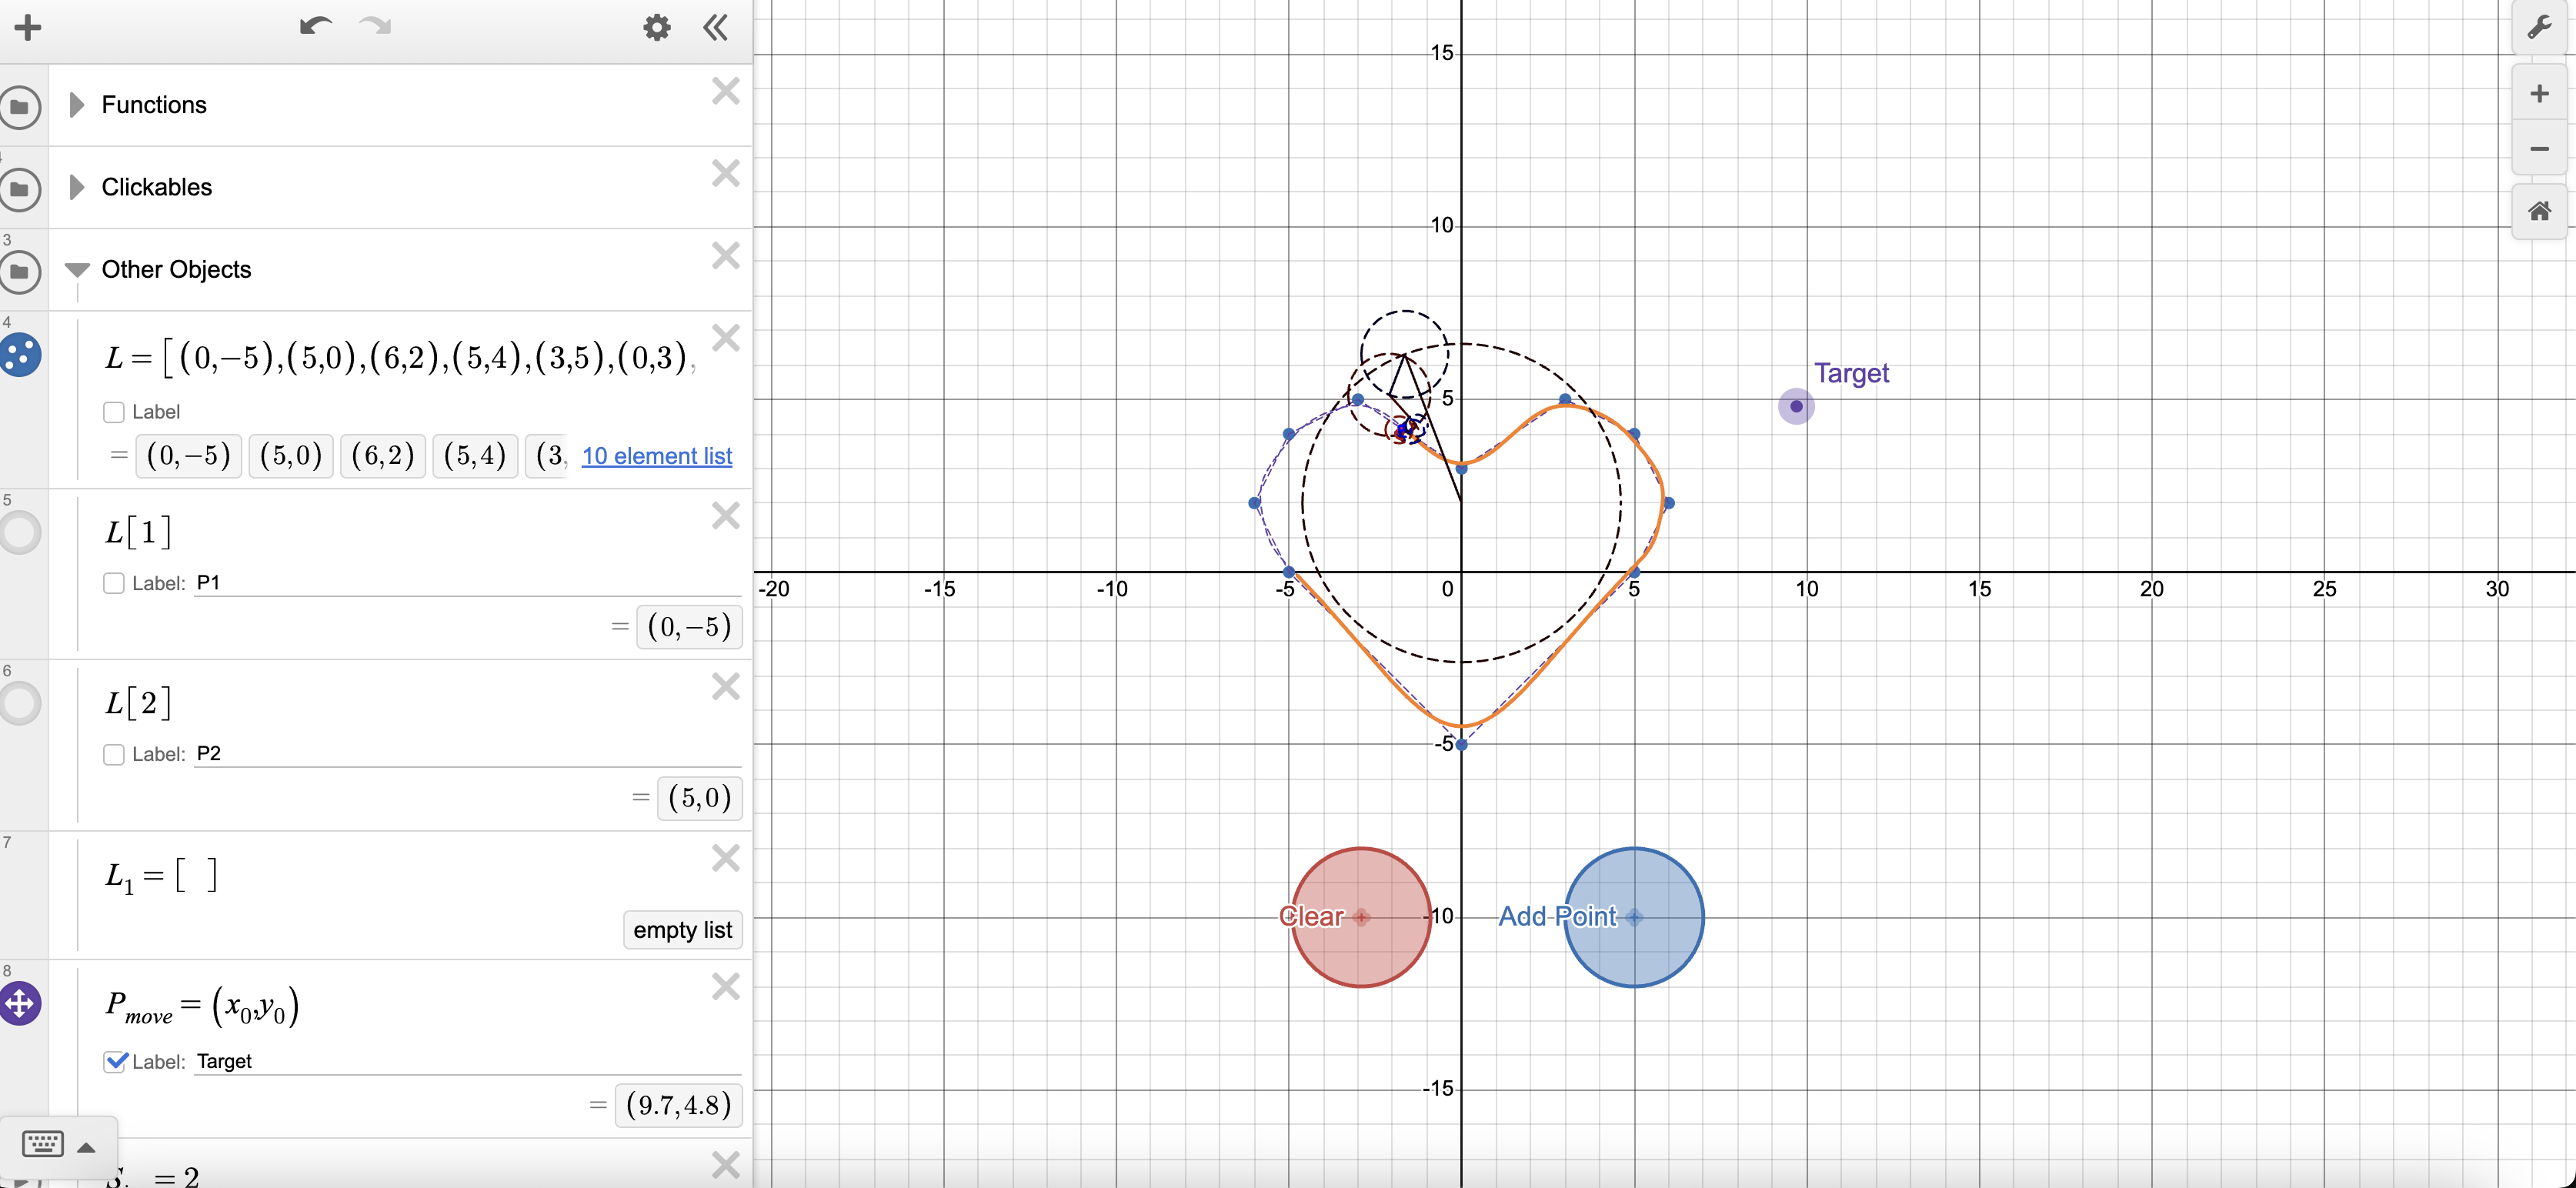
A desmos that shows the transformation of the complex plane by a defined function.
Fourier Epicycle Tracer | 2025
One of the more popular visual mathematical animations, a fourier epicycle is calculated to trace along plotted points and form an image.
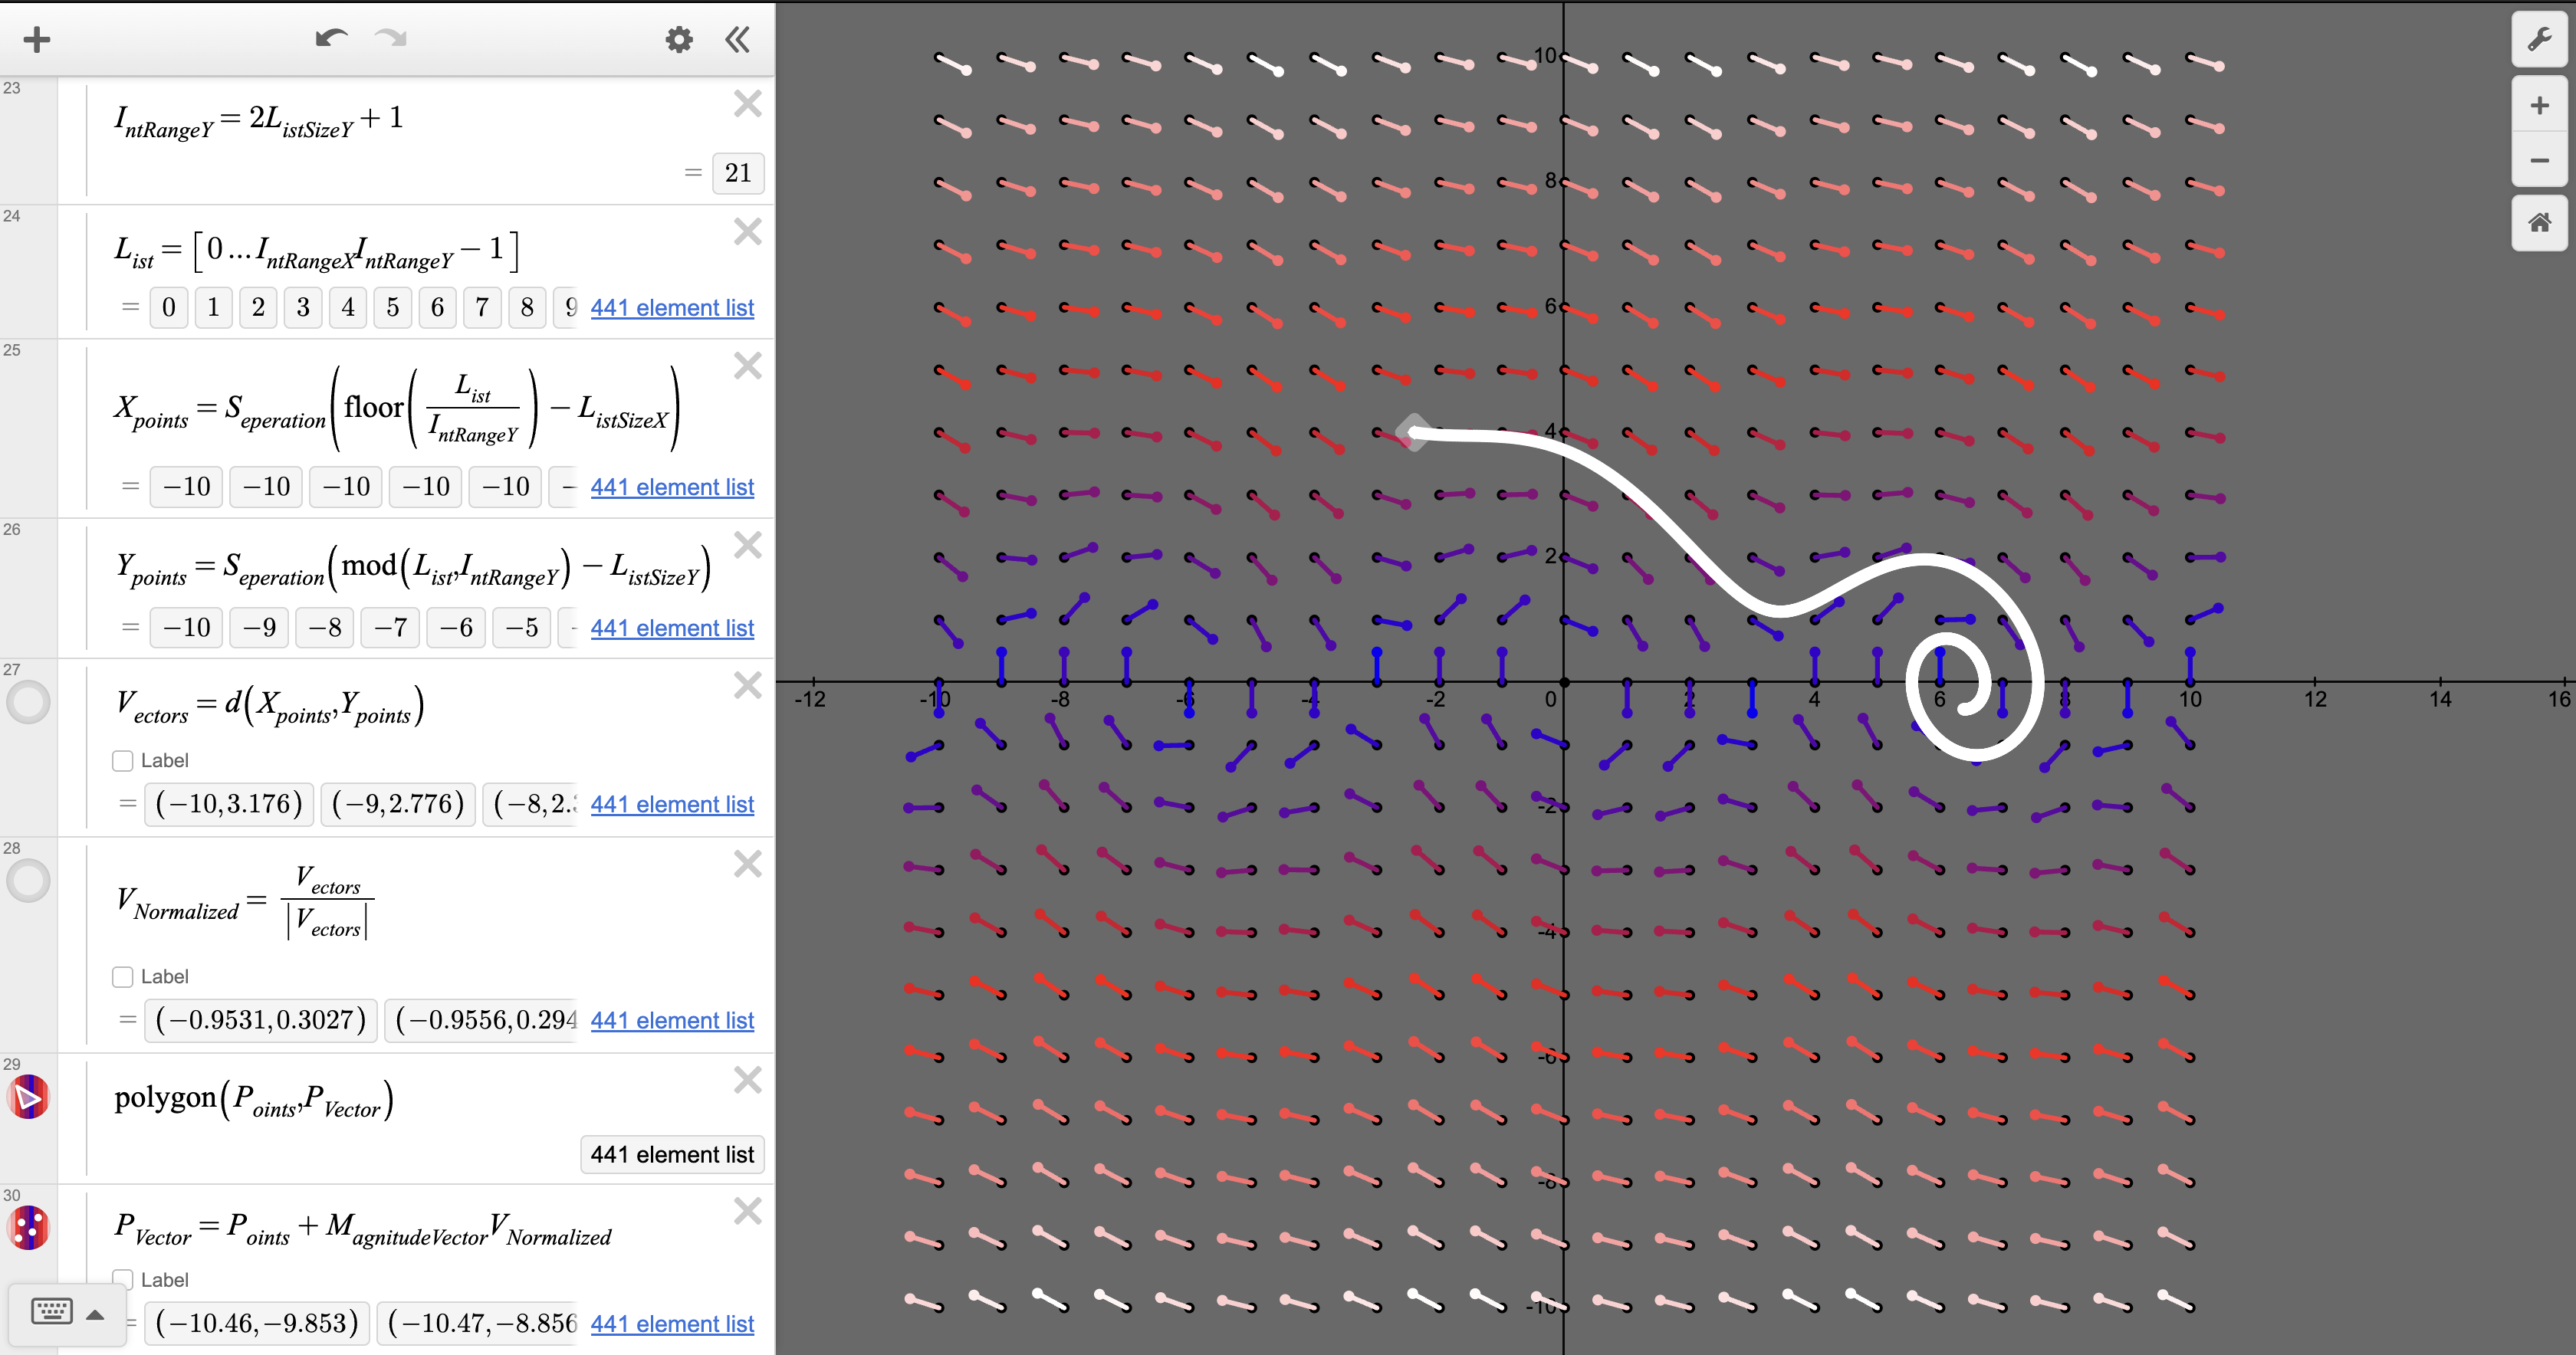
A desmos that plots a grid of vectors to explore the development of systems with different functions of their change. Plotted currently is the vector space created by a pendulum.
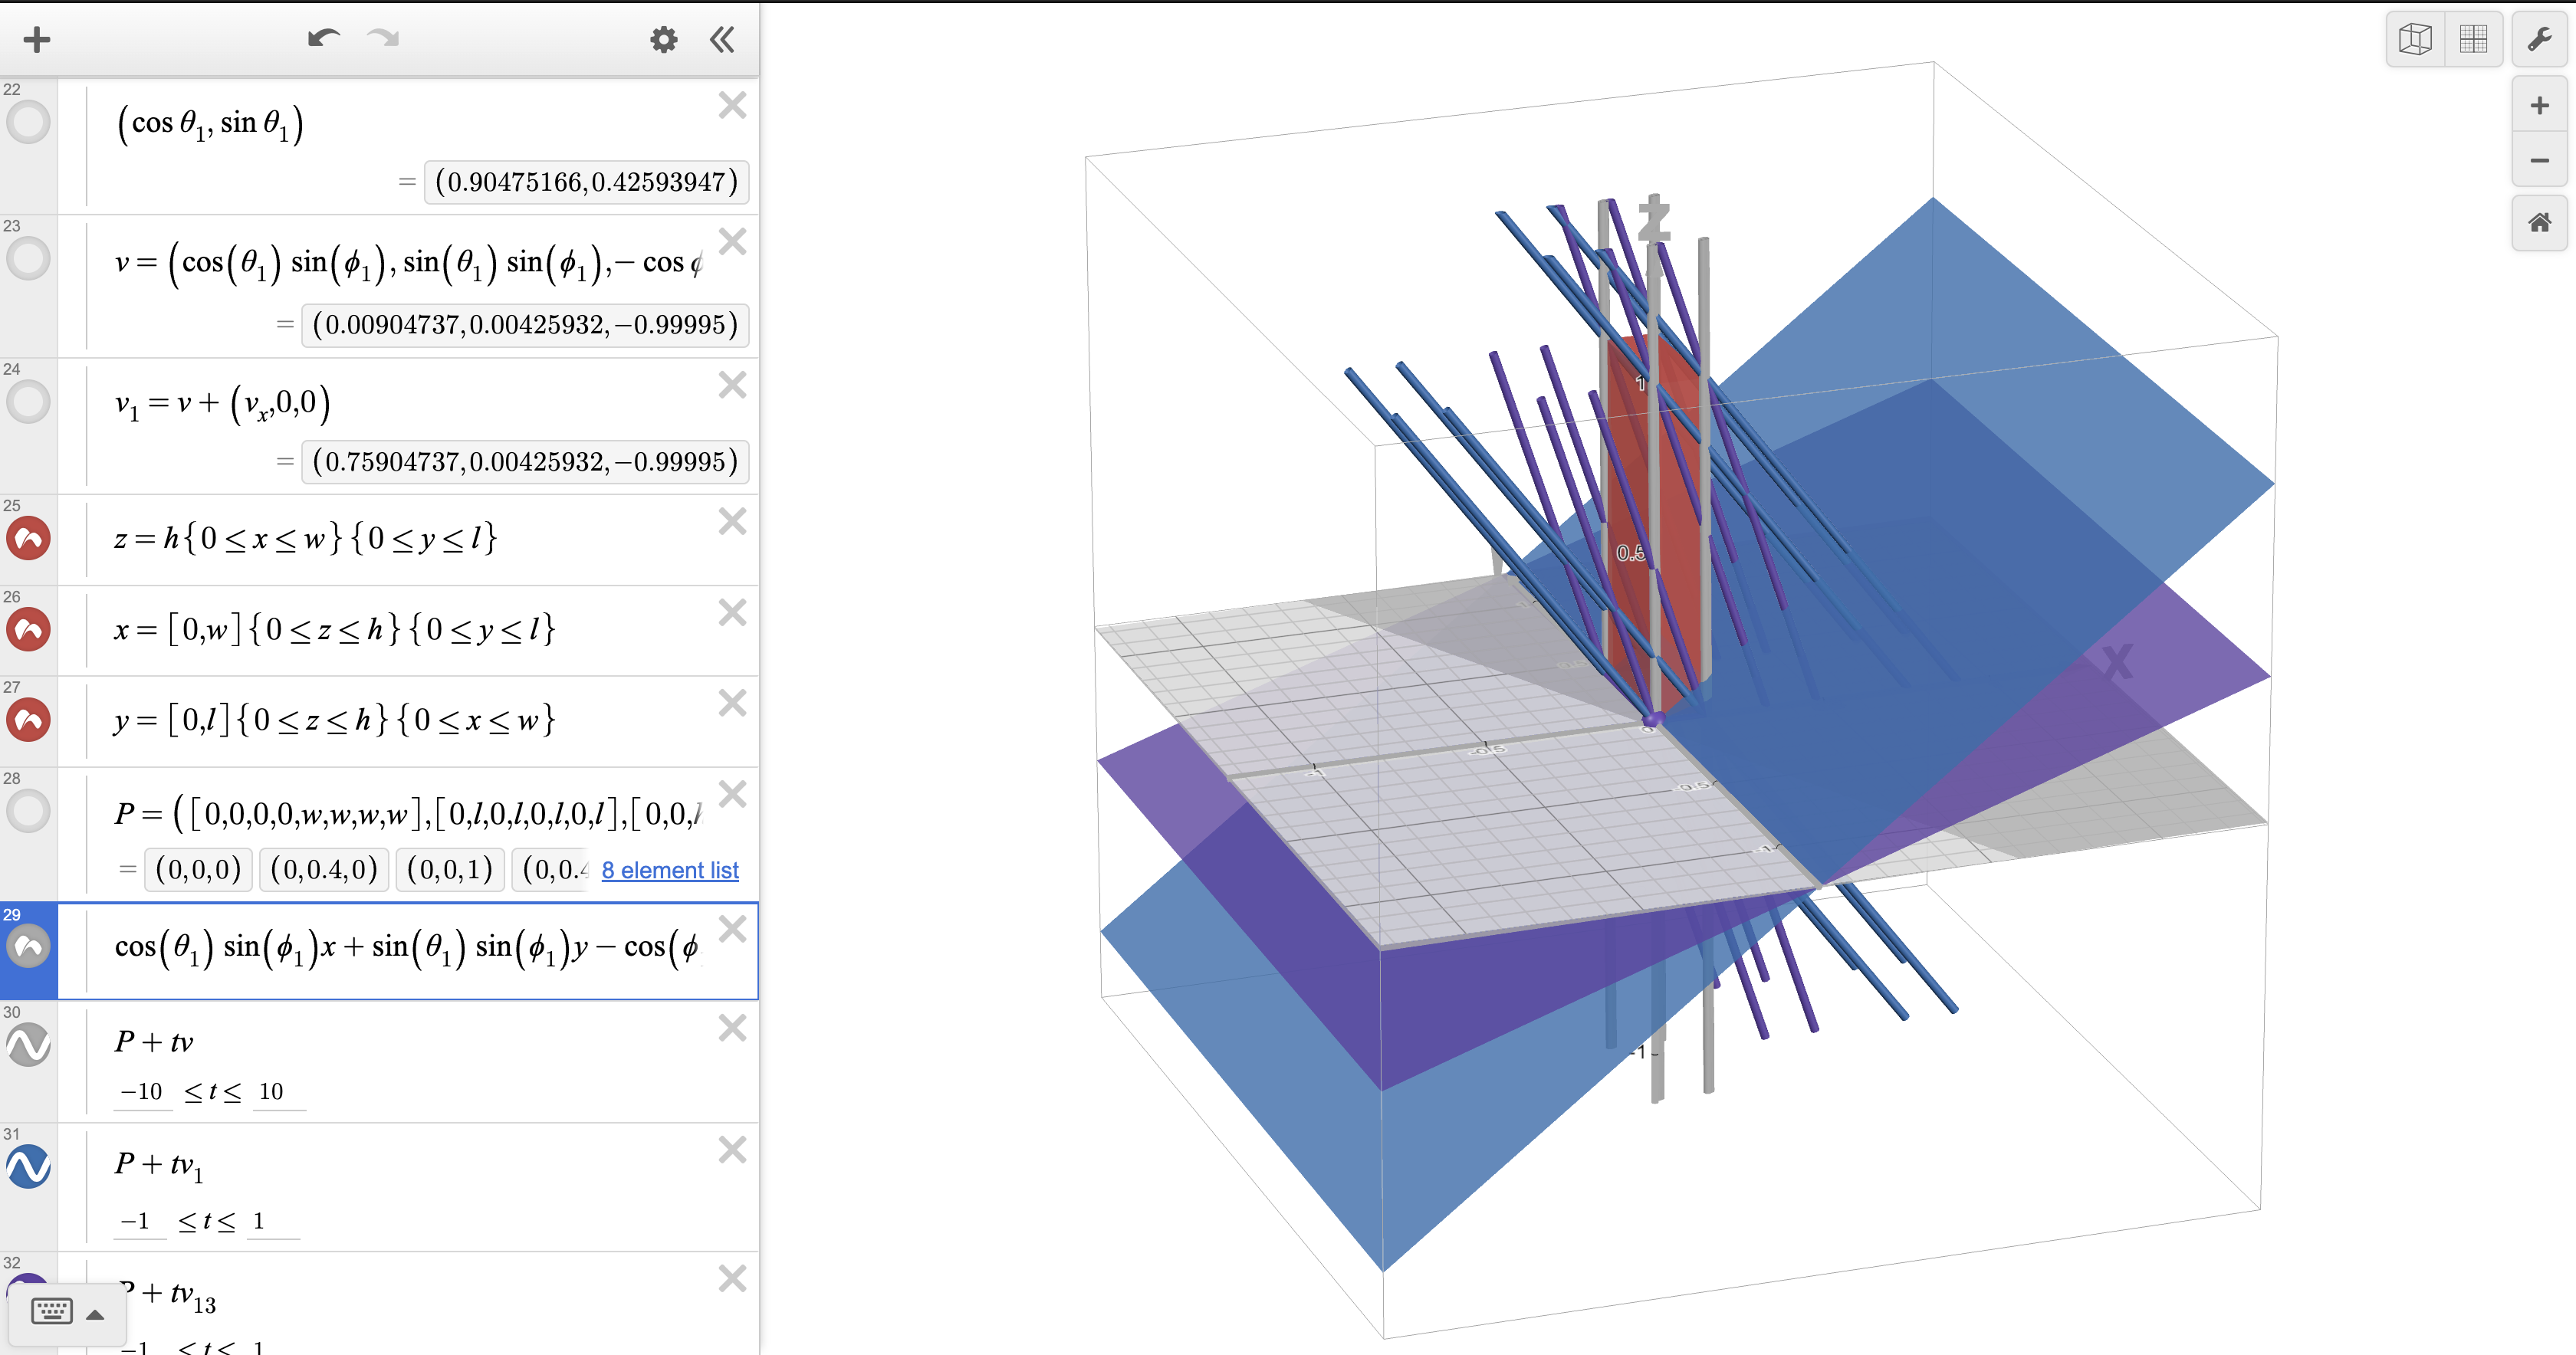
Should You Run in the Rain | 2025
The question, 'Should you run in the rain?' came up in conversation which prompted this graph. This graph calculates the amount of rain a person (approximated as a rectangular prism) experiences by finding their cross-sectional area perpendicular to the rain's falling vector at different moving speeds. The area is multiplied by the flux of the rain and the distance divided by the speed. My findings were that running is more likely to be worse if you are moving with the horzontal direction of the rain. In this case, at walking speed the rain falls closely parallel to your standing compared to hitting your front when running.
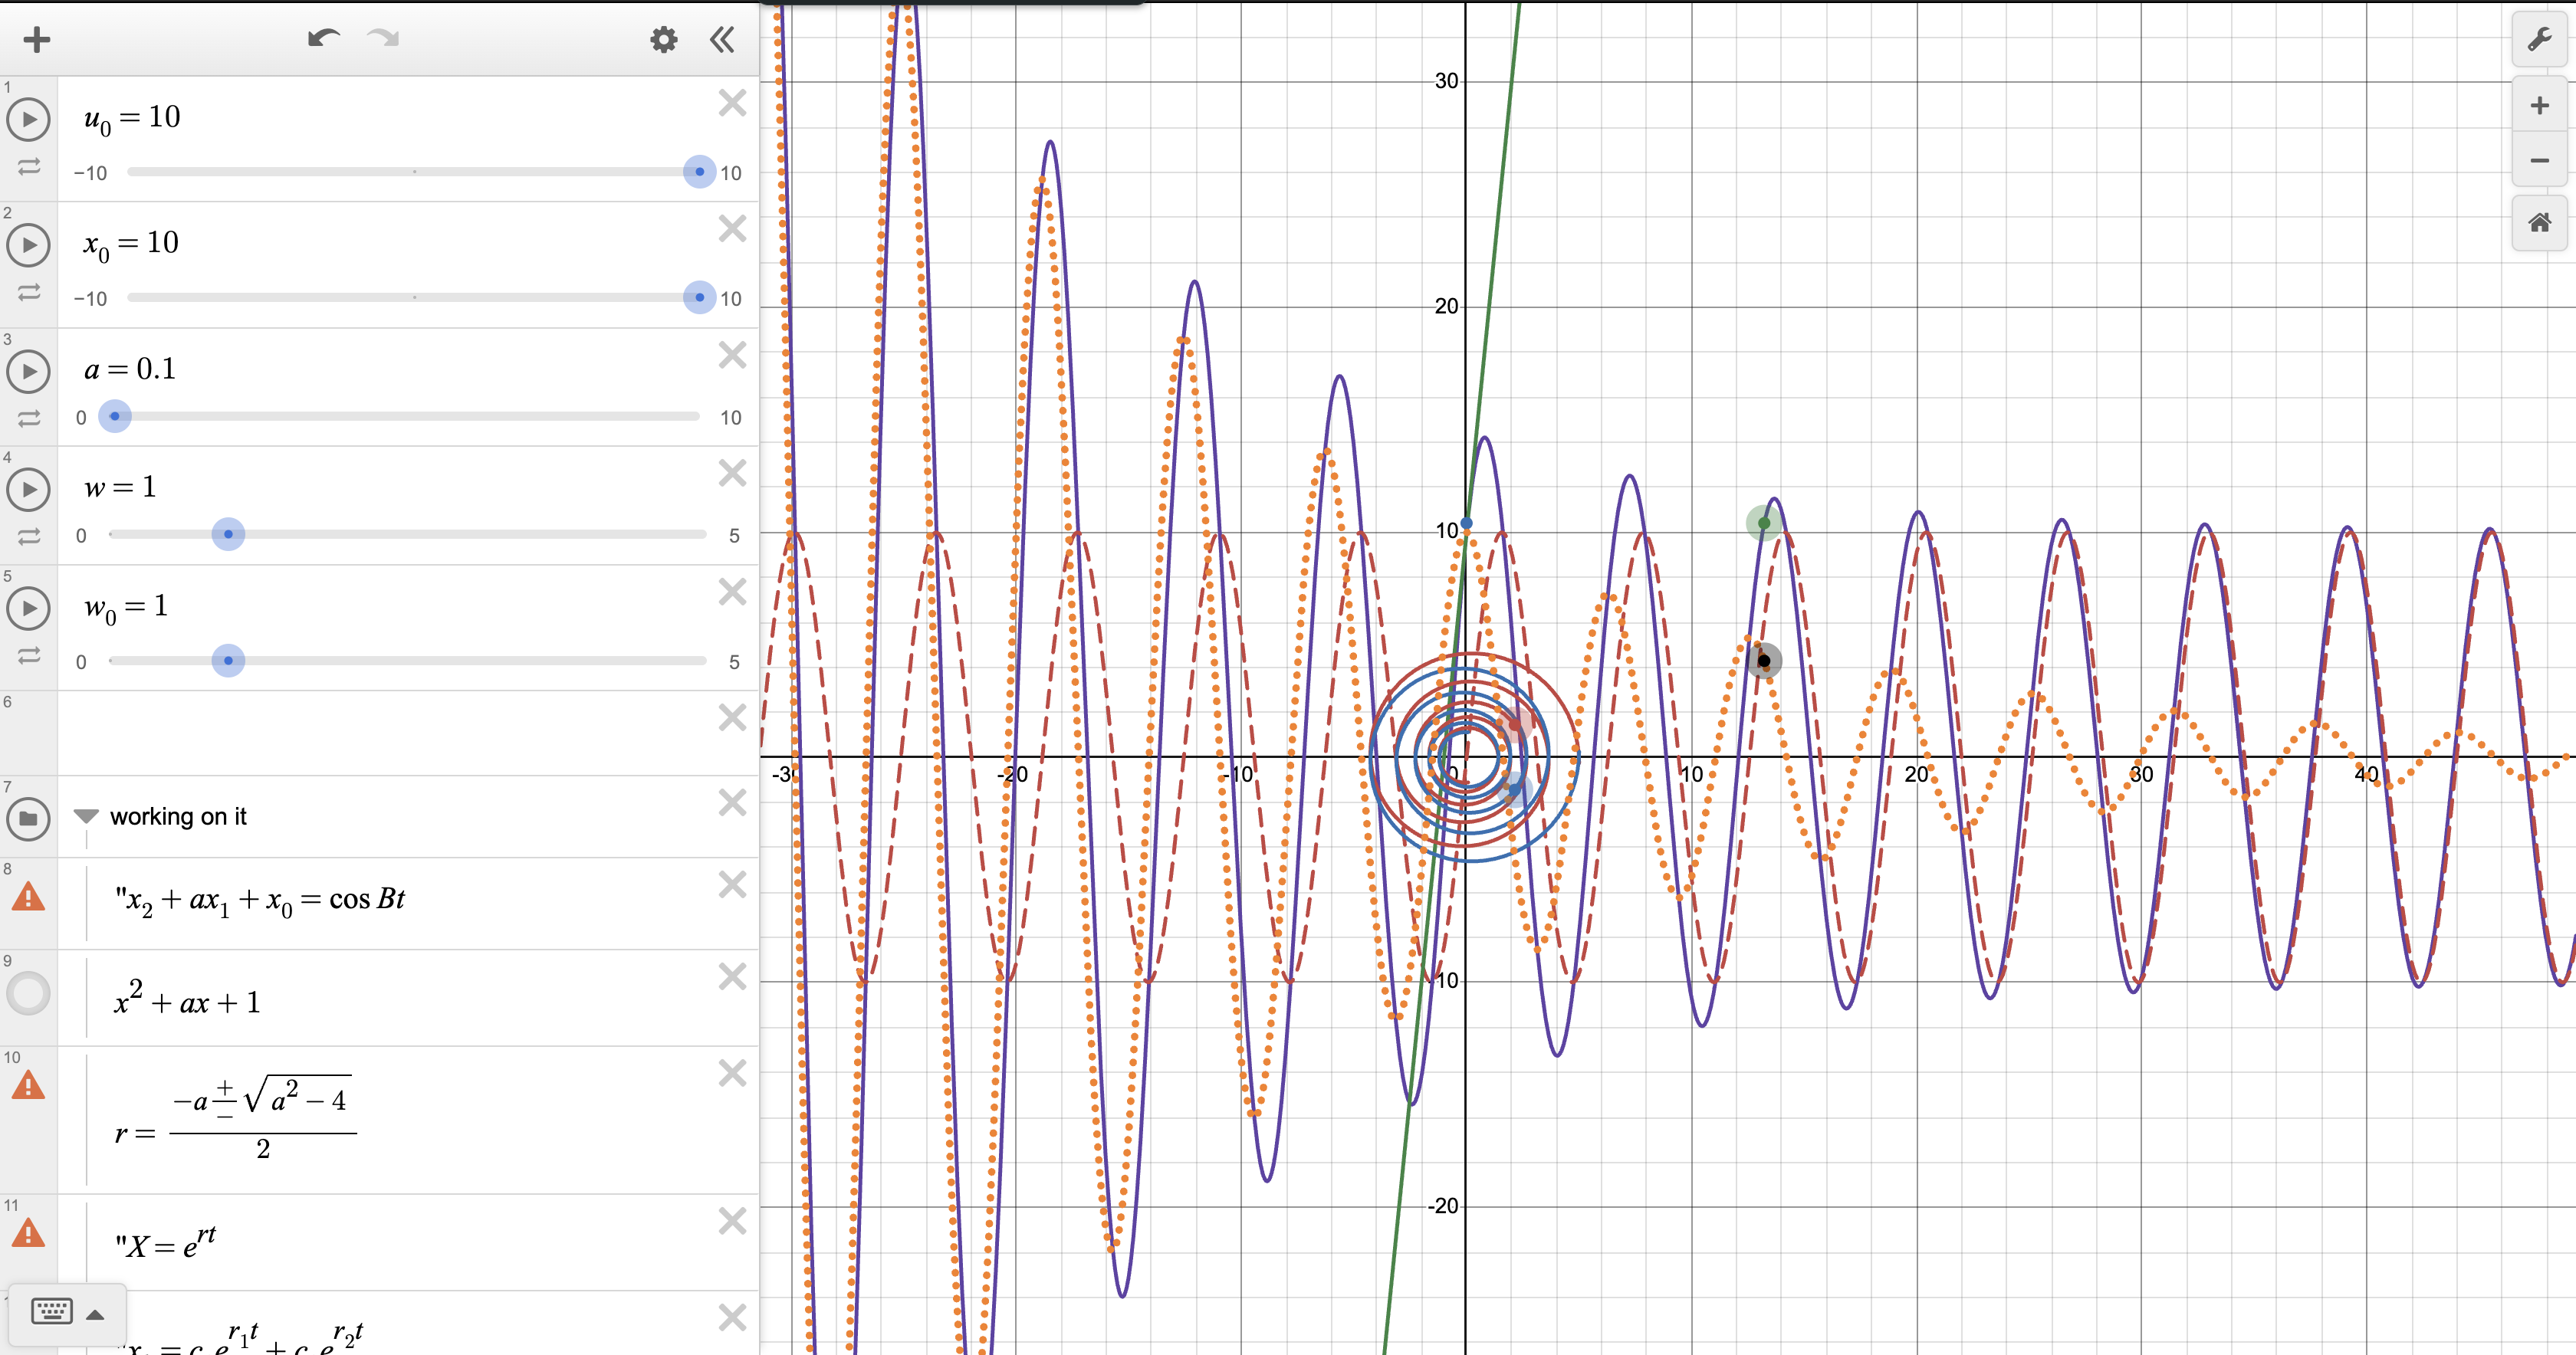
A desmos plot of a damped harmonic oscillator, its position-time solution, homogeneous solution, and particular solution. While reading about differential equations, this graph came about to visualize the similarities and differences between the homogeneous and particular solutions.
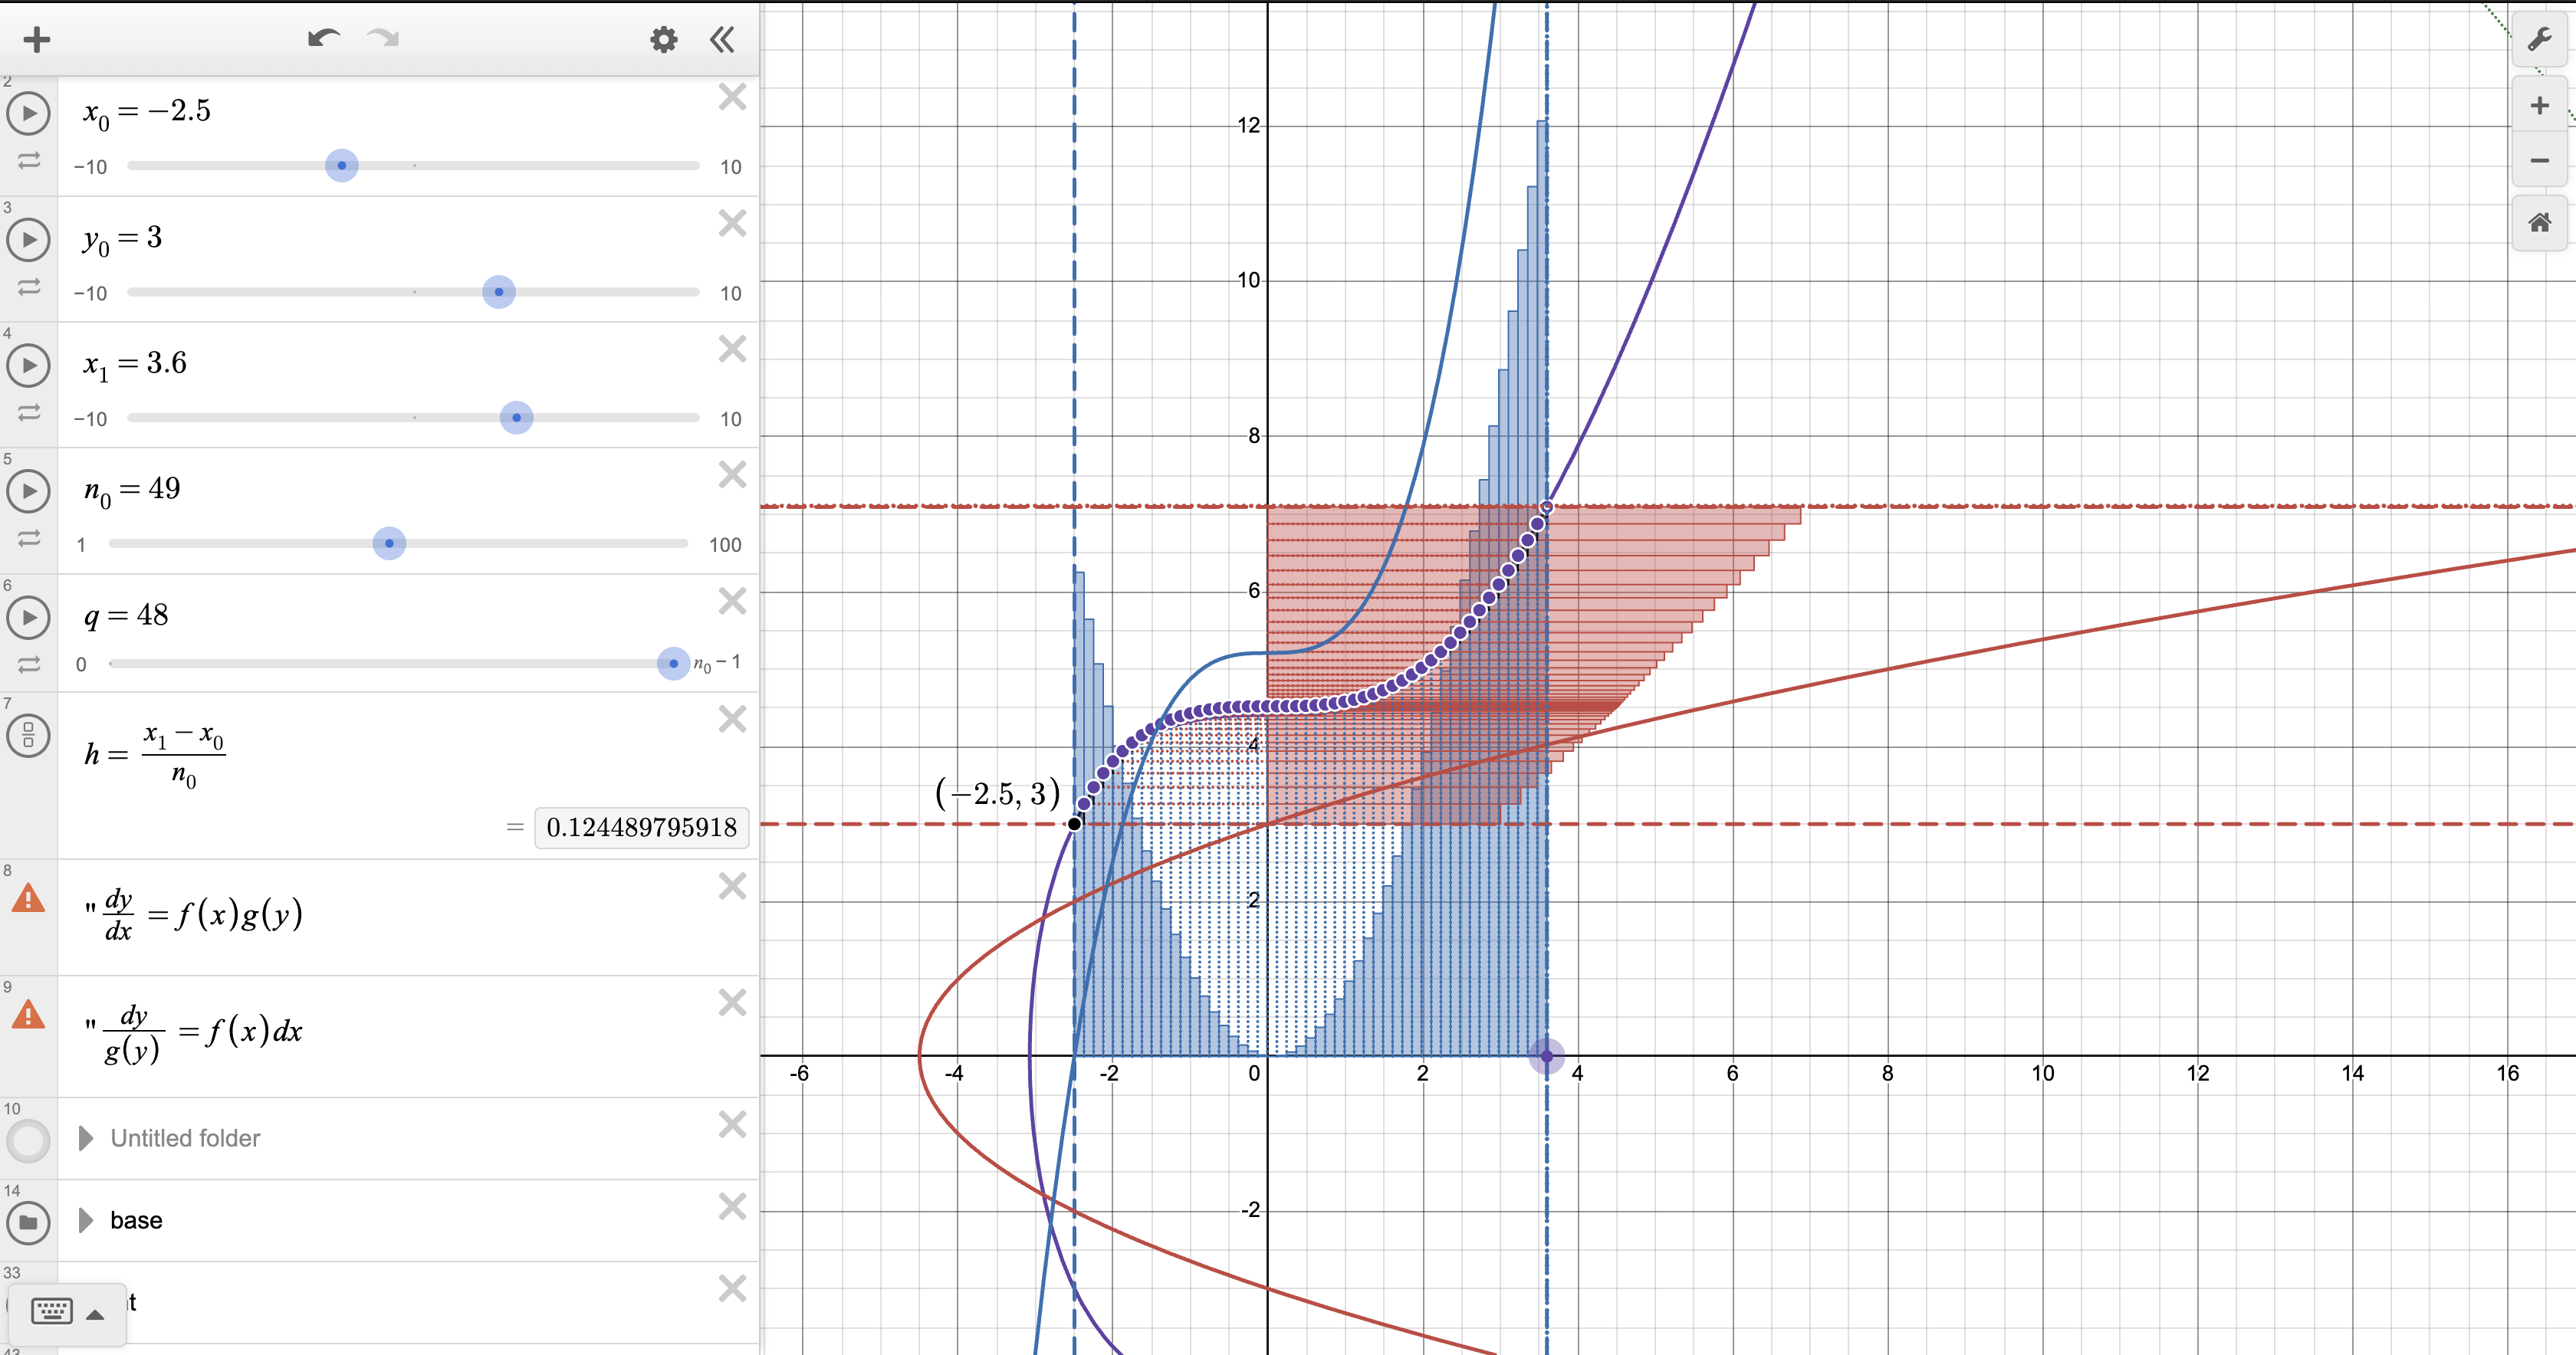
To solve a separable equation, the integral of both sides can be taken with initial conditions. To explore why this works, this graph visualizes my interpretaion of finding matching areas from small changes in x related to the changes in y.
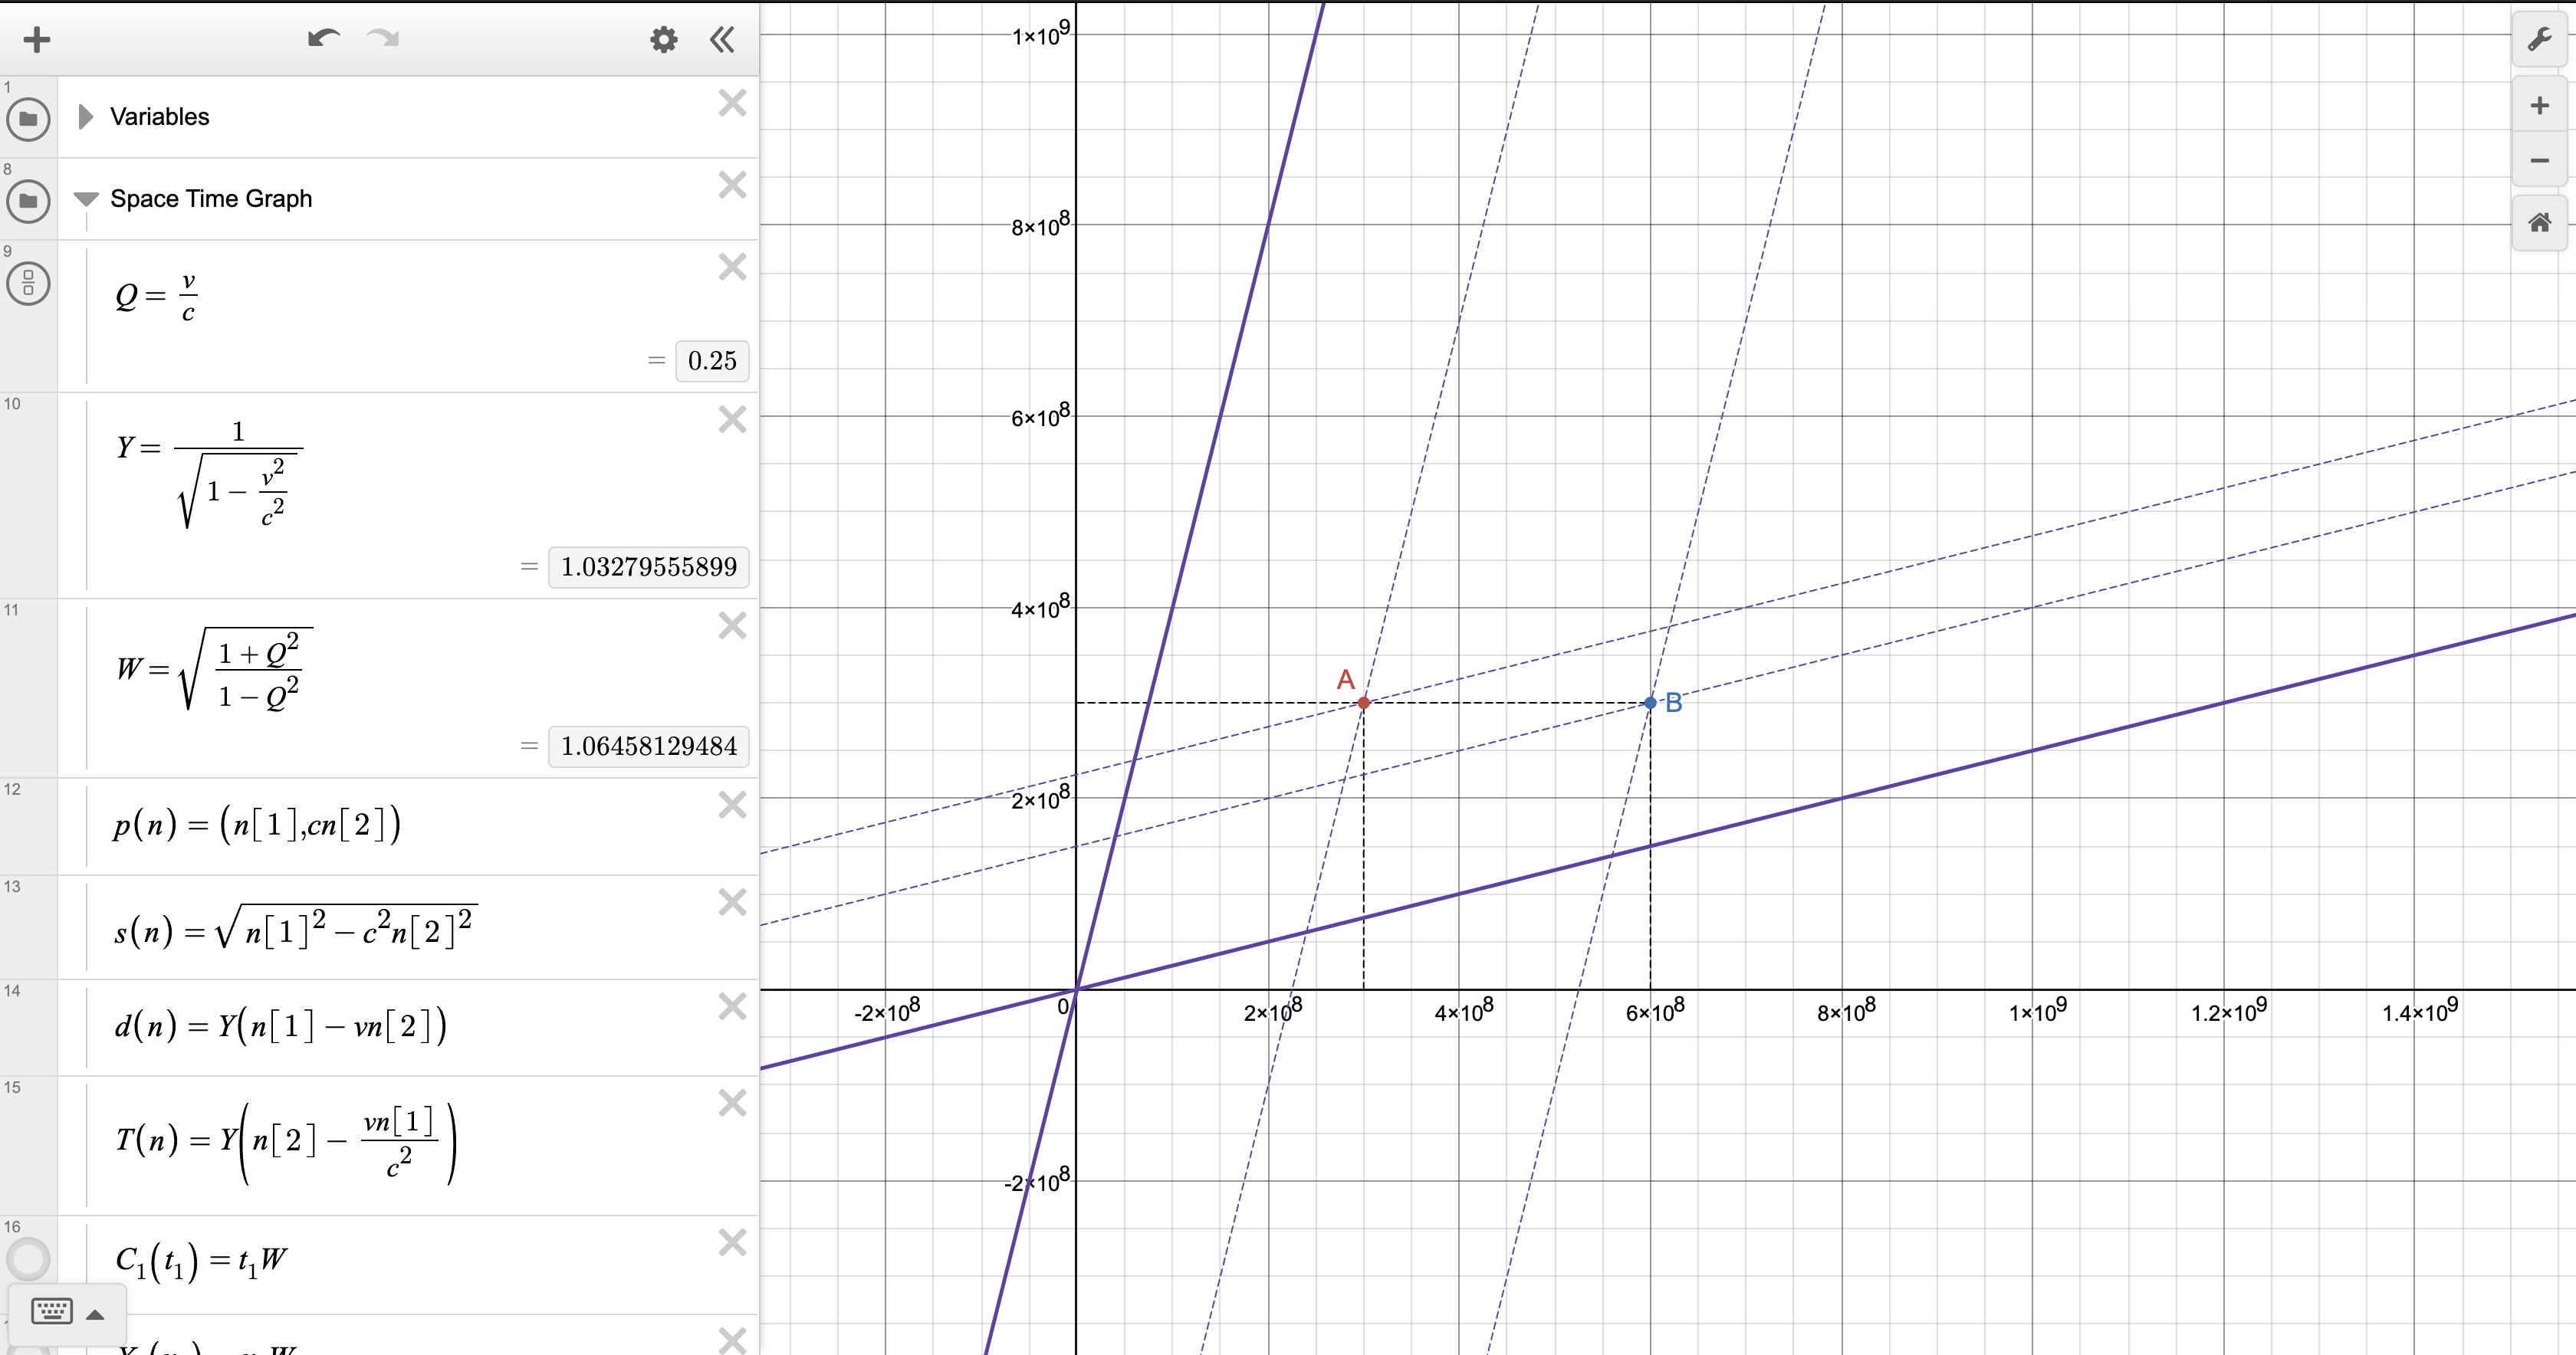
This graph shows a space-time graph, displaying time dilation and length contraction through the shifting of the axes.